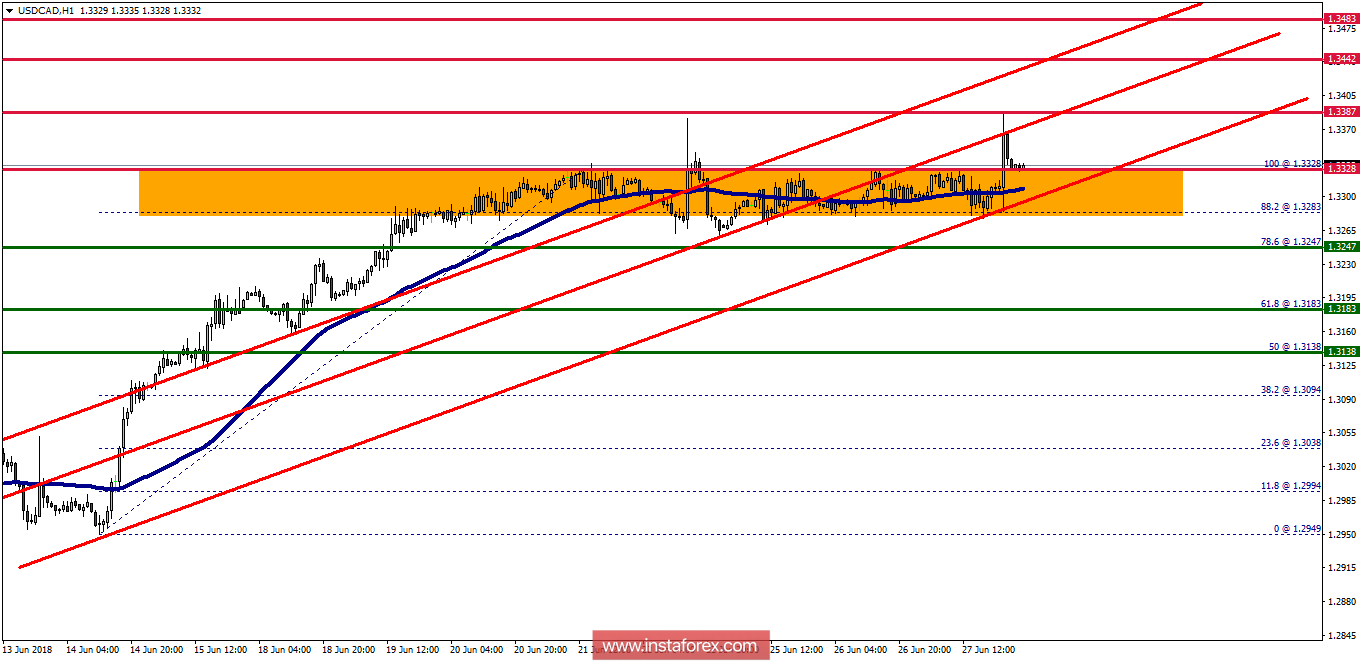
The USD/CAD pair broke the resistance that turned into strong support at the level of 1.3247 since days. The level of 1.3247 coincides with the ratio of 78.6% Fibonacci which is expected to act as a major support on the H1 chart today. Consequently, the first support is set at the level of 1.3247. Moreover, the RSI starts signaling an upward trend, and the trend is still showing strength above the moving average (100). Hence, the market is indicating a bullish opportunity above the area of 1.3247/1.3300. So, the market is likely to show signs of a bullish trend around 1.3247 - 1.3300. In other words, buy orders are recommended above the ratio of 78.6% Fibonacci (1.3247) with the first target at the level of 1.3387 in order to test the first resistance in the same time frame. If the pair succeeds to pass through the level of 1.3387, the market will probably continue towards the next objective at 1.3442. The daily strong support is seen at 1.3247. Thus, if a breakout happens at the support level of 1.3243, then this scenario may be invalidated.
 English
 Русский
 Bahasa Indonesia
 Bahasa Malay
 ไทย
ไทย Español
 Deutsch
 Български
 Français
 Tiếng Việt
 中文
中文 বাংলা
বাংলা हिन्दी
 Čeština
 Українська
 Română

