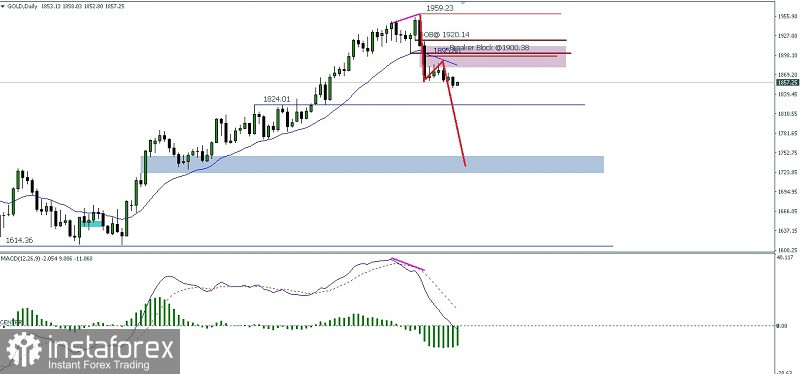
After testing the level of the Bearish Fair Value Gap area which functions as a quite significant resistance level on the daily chart for commodity assets Gold it seems that within the next few days Gold has the potential to be corrected down to the level of 1824.01 moreover this condition has also been confirmed by the appearance of deviations between movements the price of Gold with the MACD indicator so if this level is successfully broken down then Gold will have the potential to continue its decline to the level of 1727.97 but please note if on its way down Gold suddenly experiences an upward movement which exceeds the level 1918.13 then there is a high probability of a decline scenario that has been described will become invalid and automatically cancel by itself.
(Disclaimer)
 English
 Русский
 Bahasa Indonesia
 Bahasa Malay
 ไทย
ไทย Español
 Deutsch
 Български
 Français
 Tiếng Việt
 中文
中文 বাংলা
বাংলা हिन्दी
 Čeština
 Українська
 Română

