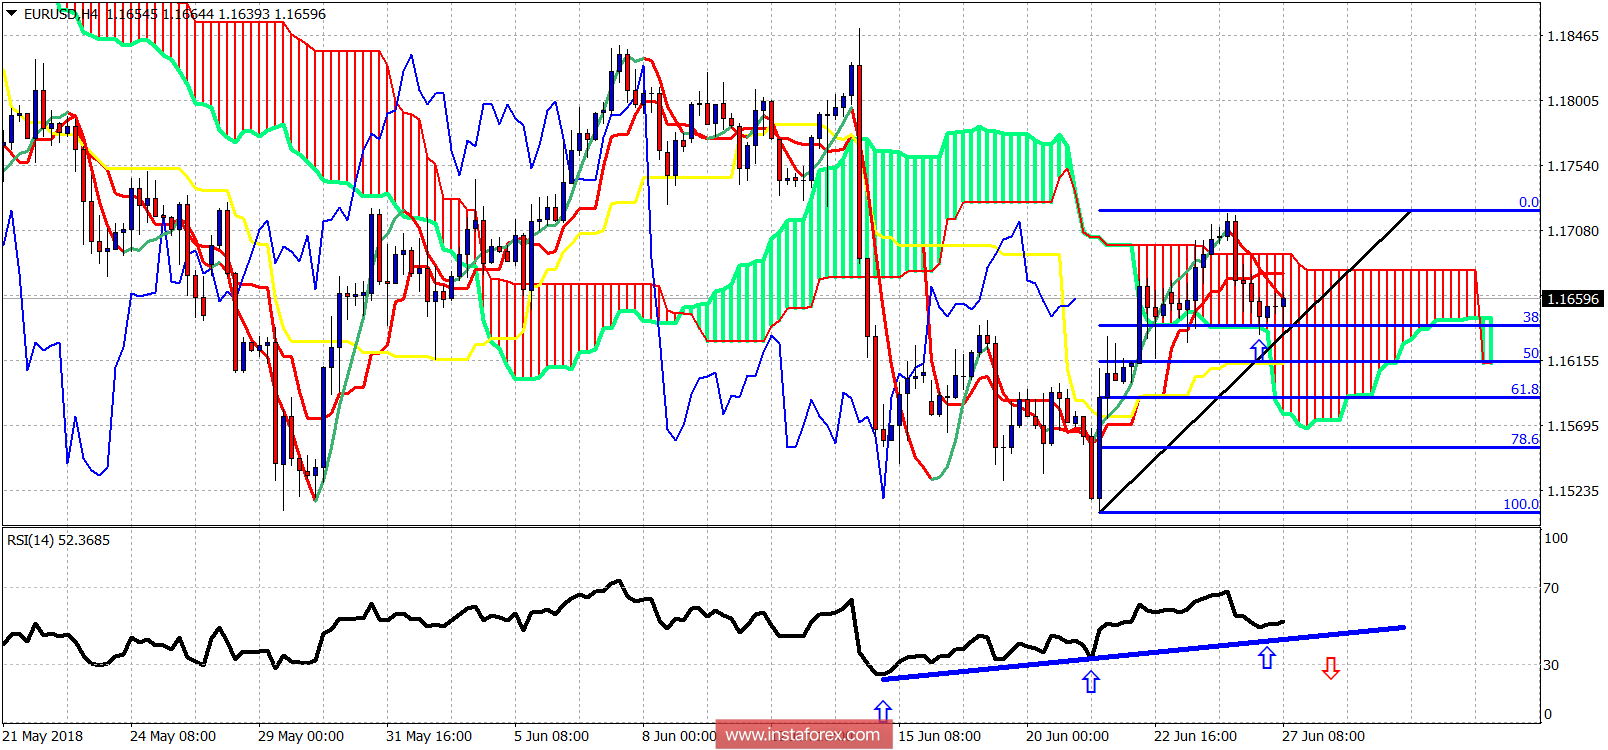
EUR/USD got rejected yesterday at the 61.8% Fibonacci retracement and pushed below the short-term support at 1.1690. The price pulled back towards the lower cloud boundary and 38% Fibonacci retracement at 1.1640 and found support.

 Long-term review
EUR/USD got rejected yesterday at the 61.8% Fibonacci retracement and pushed below the short-term support at 1.1690. The price pulled back towards the lower cloud boundary and 38% Fibonacci retracement at 1.1640 and found support.
