Technical outlook:
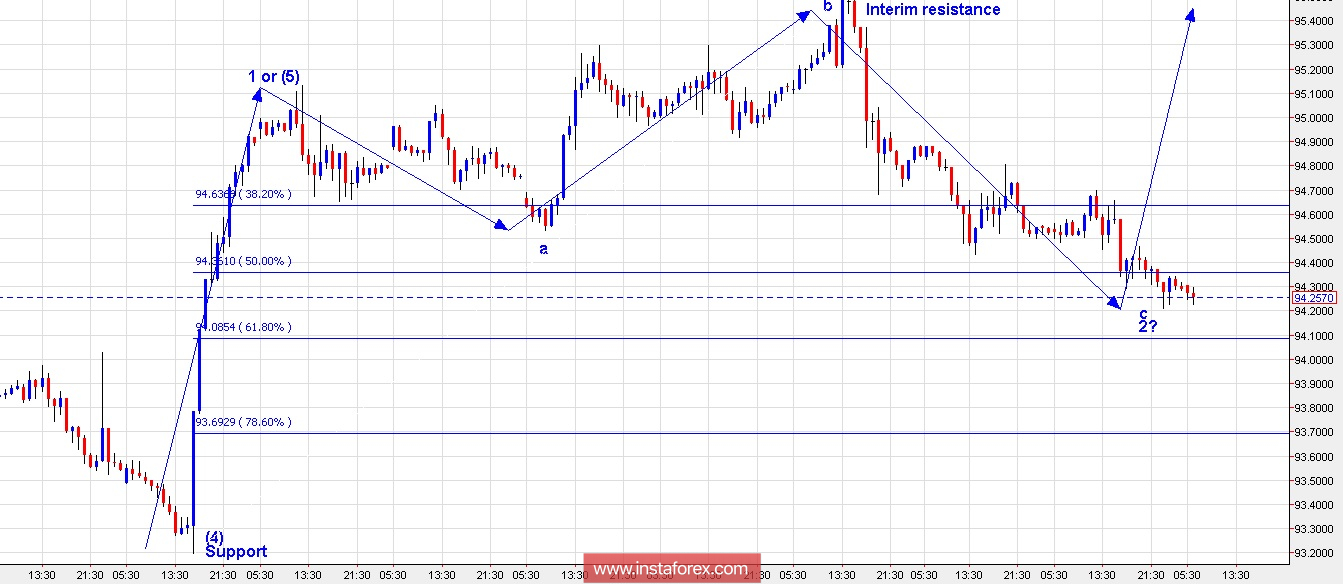
A short-term 1-hour chart view has been presented here, to look into the most probable wave count. The US Dollar Index most likely terminated into wave (4) of a higher degree around 93.20 levels earlier. The subsequent rally was an impulse, which is labeled as wave 1 of the 5th wave or wave (5) itself. Furthermore, the wave structure has been like that of an expanded flat 3-3-5 and hence labeled as a-b-c, corrective wave. Also please note that prices are trading very close to the Fibonacci 0.618 support near 94.10/20 levels. If the above structure holds to be true, we should see the US Dollar Index reverse/rally from these levels any time now. Only if prices break below 93.20 levels, can we conclude that a more complex corrective wave (4) is underway? Until prices stay above 93.20 levels, we remain optimistic for a potential rally ahead.
Trading plan:
Long now (94.15/25), stop below 93.20, target above 96.00
Fundamental outlook:
Watch out for US Consumer confidence to be out today at 10:00 AM EST.
Good luck!
 English
 Русский
 Bahasa Indonesia
 Bahasa Malay
 ไทย
ไทย Español
 Deutsch
 Български
 Français
 Tiếng Việt
 中文
中文 বাংলা
বাংলা हिन्दी
 Čeština
 Українська
 Română

