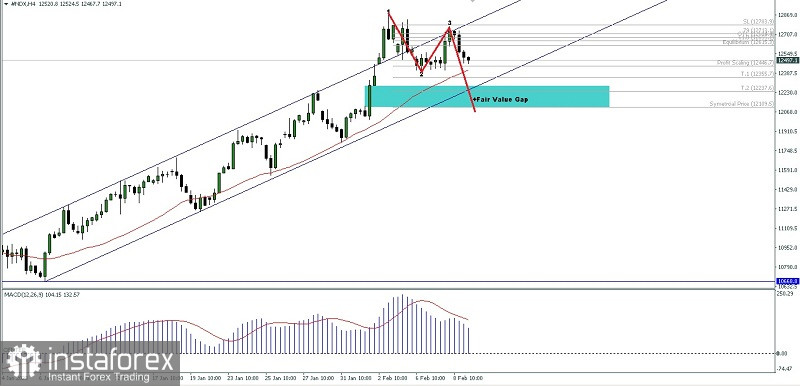
As we know, the price movement on the 4-hour chart, the Nasdaq 100 index is still in a bullish condition where all of this can be seen by the price movement moving above the Moving Average and in the channel that is swooping up but with the appearance of the Double Top Pattern in the form of the Bearish 123 pattern giving a hint if in the near future there will be a downward correction to the level of 12411.8 if this level is successfully broken down then #NDX has the potential to continue its downward correction to enter the level area 12285.6-12155.2 as the next target but if it is on its way to the target levels that have been mentioned earlier suddenly the #NDX reverses towards its previous bias especially if it breaks above the 12783.9 level then it is very likely that the downward correction scenario described earlier will become invalid and automatically cancel itself.
(Disclaimer)
 English
 Русский
 Bahasa Indonesia
 Bahasa Malay
 ไทย
ไทย Español
 Deutsch
 Български
 Français
 Tiếng Việt
 中文
中文 বাংলা
বাংলা हिन्दी
 Čeština
 Українська
 Română

