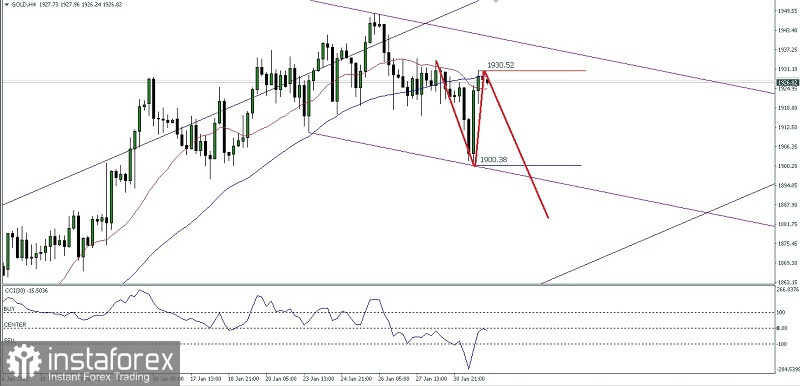
On the 4-hour chart, it can be seen that this commodity asset is being held back by the Resistance level at 1930.52 so that in the near future it has the potential to depreciate to the level of 1900.38 where this has also been confirmed by the MA 10 which is below the MA 20 plus price movements inside the channel which go down indicated that the sellers were dominating the previous buyers. However, please pay attention if on the way down, this commodity asset suddenly reverses up and breaks the level of 1934.50, then it is very likely that the downward scenario described earlier will cancel itself.
(Disclaimer)
 English
 Русский
 Bahasa Indonesia
 Bahasa Malay
 ไทย
ไทย Español
 Deutsch
 Български
 Français
 Tiếng Việt
 中文
中文 বাংলা
বাংলা हिन्दी
 Čeština
 Українська
 Română

