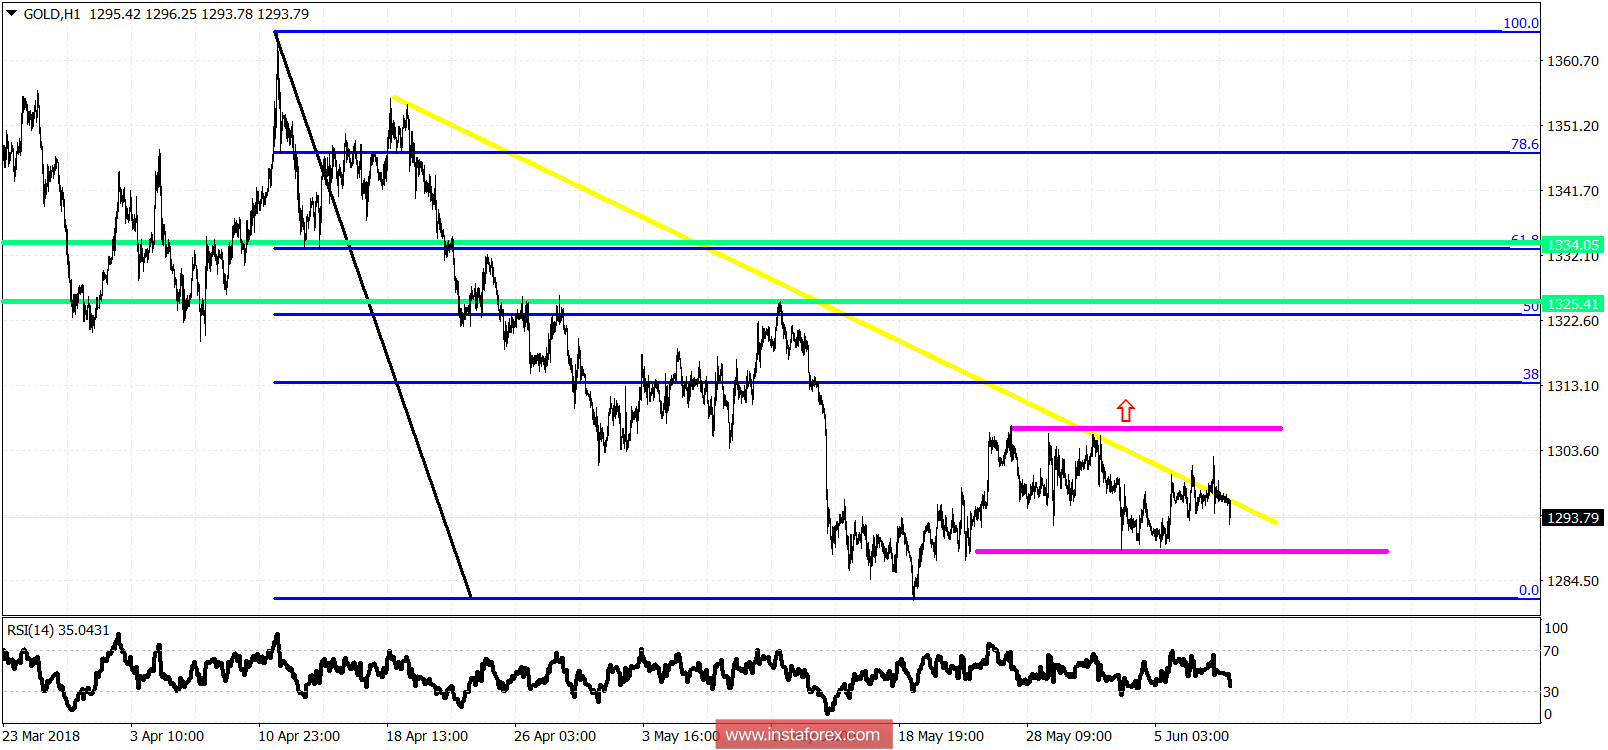
Yesterday gold was unable to break above $1,300-$1,307 resistance level. Sellers pulled the price back below $1,295. Gold price continues to trade in a sideways trading range between $1,290 and $1,304. It is expected to move higher towards $1,320-30, but there is no confirmation yet for this scenario.

Magenta lines - trading range
Yellow line - medium-term trend line resistance
Green horizontal lines - Fibonacci targets
Gold price tried to push above the medium-term yellow trend line resistance but got rejected. This is a bearish sign. Gold price remains inside the magenta trading range for more than a week. The key resistance remains at $1,307 and at $1,297 in the short term. A daily close above $1,297 will be the first step to a new wave higher. Support is at $1,290 and the next one lies at $1,275.
 English
 Русский
 Bahasa Indonesia
 Bahasa Malay
 ไทย
ไทย Español
 Deutsch
 Български
 Français
 Tiếng Việt
 中文
中文 বাংলা
বাংলা हिन्दी
 Čeština
 Українська
 Română

