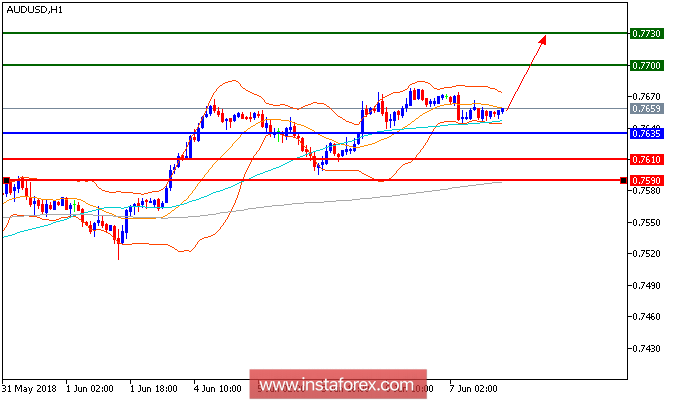
AUD/USD is expected to trade with a bullish outlook. The pair is currently trading around the 20-day moving average while being well supported by the 50-day moving average. The relative strength index has managed to stand above the neutrality level of 50, showing a lack of downward momentum for the pair. As long as intraday bullishness is maintained, the pair should proceed toward the key 0.7700 level on the upside. However, losing the key support at 0.7635 would open a path toward 0.7610 on the downside.
Fundamental Overview: earlier today data shows Australia's construction industry expanded in May, a 16th-consecutive month in positive territory. The performance of construction index fell 1.4 points to 54; a reading above 50 indicates expansion. Solid Australian economic activity is unlikely to convince the RBA to raise the cash rate anytime soon. From a near-term monetary policy perspective, trends in wages and unemployment, and the housing market are the ones to focus on.
Chart Explanation: The black line shows the pivot point. Currently, the price is above the pivot point which is a signal for long positions. If it remains below the pivot point, it will indicate short positions. The red lines show the support levels, while the green line indicates the resistance levels. These levels can be used to enter and exit trades.
Resistance levels: 0.7700, 0.7730, 0.7775
Support levels: 0.7635, 0.7610, 0.7590
 English
 Русский
 Bahasa Indonesia
 Bahasa Malay
 ไทย
ไทย Español
 Deutsch
 Български
 Français
 Tiếng Việt
 中文
中文 বাংলা
বাংলা हिन्दी
 Čeština
 Українська
 Română

