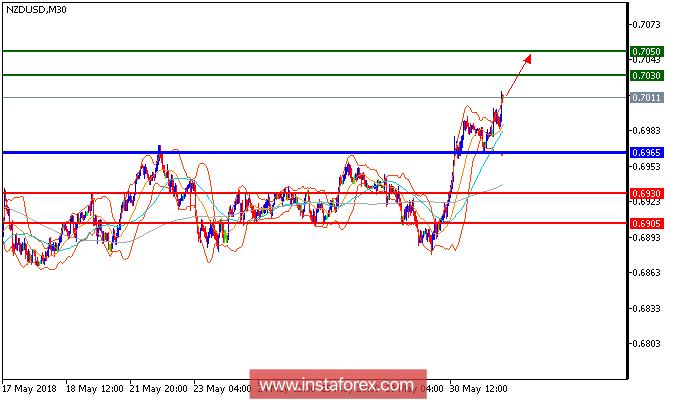
Our first target which we predicted in previous analysis has been hit. The pair posted a strong rebound yesterday, and is expected to challenge its next resistance at 0.7030. The 50-period moving average is turning up now, and should act as a strong support role. In addition, the relative strength index is bullish above its neutrality area at 50. In which case, as long as 0.6965 is not broken, likely advance to 0.7030 and 0.7050 in extension.
Fundamental outlook:
Earlier today New Zealand business confidence and firms' views of their own activity eased 4 points in May, with a net 27% of businesses now pessimistic about the year ahead. Companies' views of their own activity dipped to +14, the lowest since November. New Zealand business confidence has softened, sending a warning signal to the still fledgling center-left government. It seems there is plenty to worry about with ANZ's measure of business confidence sinking toward the cycle lows after last year's election.
Chart Explanation: The black line shows the pivot point. Currently, the price is above the pivot point which is a signal for long positions. If it remains below the pivot point, it will indicate short positions. The red lines show the support levels, while the green line indicates the resistance levels. These levels can be used to enter and exit trades.
Resistance levels: 0.7030, 0.7050, and 0.7075
Support levels: 0.6930, 0.6905, and 0.6835
 English
 Русский
 Bahasa Indonesia
 Bahasa Malay
 ไทย
ไทย Español
 Deutsch
 Български
 Français
 Tiếng Việt
 中文
中文 বাংলা
বাংলা हिन्दी
 Čeština
 Українська
 Română

