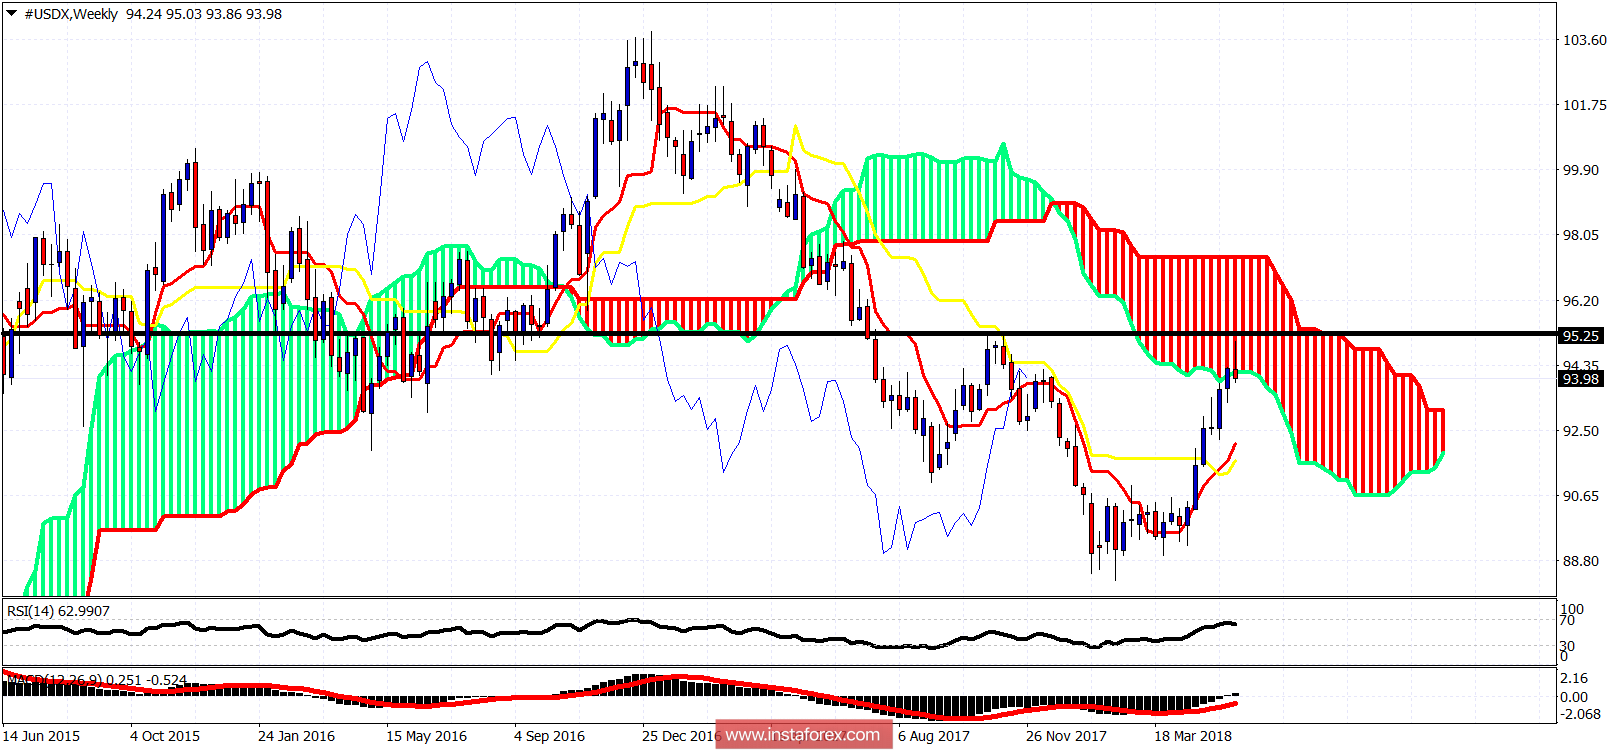
The US dollar index is breaking below 94 and shows signs of rejection at the Weekly Kumo (cloud) resistance. This justifies a pullback towards 92. This is not the time to be buying dollar but if you are bullish, you'd better wait for a pullback. I prefer to be short on the dollar.

Black line - horizontal resistance
The Dollar index reached the previous high where the black horizontal line is drawn. There was a confluence of previous high and cloud resistance at that area and bulls got rejected at that area. I believe the entire move from the 2018 lows to 95.20 is complete and we should see a resumption of the down trend in the US dollar index. The important weekly support is at 92. A break below it will open the way for new 2018 lows.
 English
 Русский
 Bahasa Indonesia
 Bahasa Malay
 ไทย
ไทย Español
 Deutsch
 Български
 Français
 Tiếng Việt
 中文
中文 বাংলা
বাংলা हिन्दी
 Čeština
 Українська
 Română

