Technical outlook:
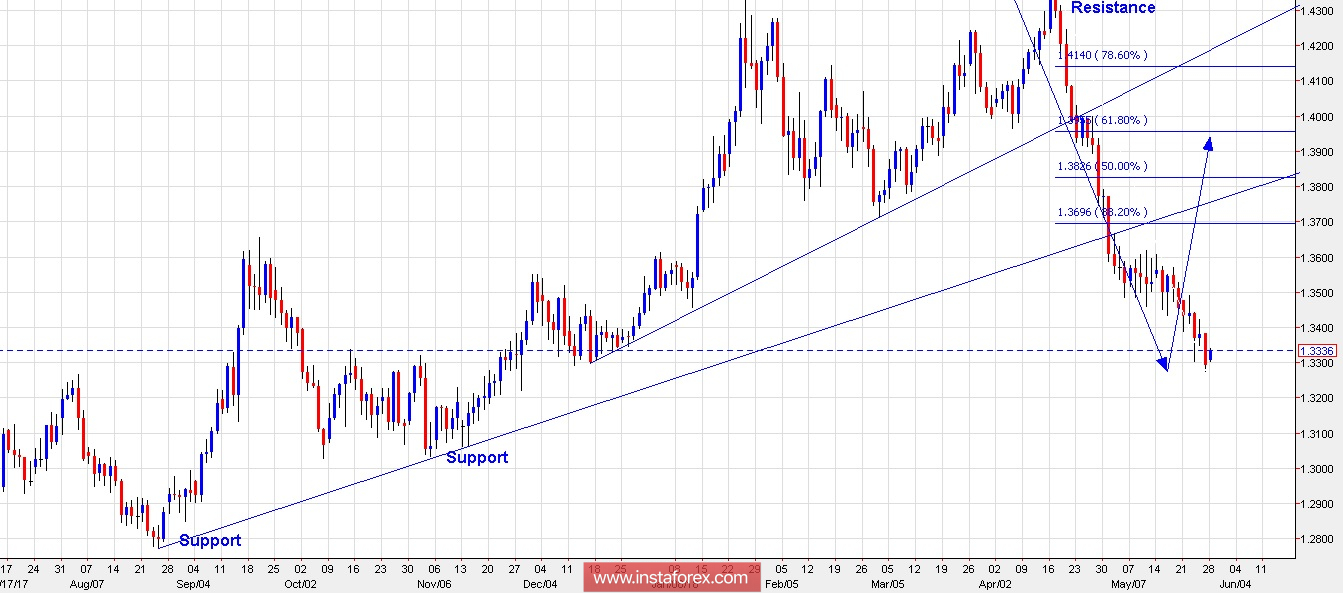
The GBP/USD daily chart might be already suggesting that the drop from 1.4360/70 levels has either completed or is about to complete its first leg at a larger degree. If you notice, the pair is producing a HARAMI candlestick pattern for now on the daily charts. This is a potential reversal pattern and indicates that price could turn bullish from here. If this holds true, the pair has an upside potential through 1.3700 levels at least and upto 1.4000 levels, which is fibonacci 0.618 resistance level as seen here. In terms of wave counts as well, an impulsive drop looks to be complete or near completion from 1.4360/70 levels and if that holds good, we should see a 3 wave counter trend rally soon, which could take prices higher up to 1.4000 levels in the next few weeks. On the flip side if GBP/USD drops below 1.3275 levels, the next support comes in between 1.3000/3100 levels.
Trading plan:
Aggressive traders may look to go long either from here or from 1.3000/3100 levels; while conservative traders may remain aside and look to sell on rallies.
Fundamental outlook:
There are no major events lined up for today.
Good luck!
 English
 Русский
 Bahasa Indonesia
 Bahasa Malay
 ไทย
ไทย Español
 Deutsch
 Български
 Français
 Tiếng Việt
 中文
中文 বাংলা
বাংলা हिन्दी
 Čeština
 Українська
 Română

