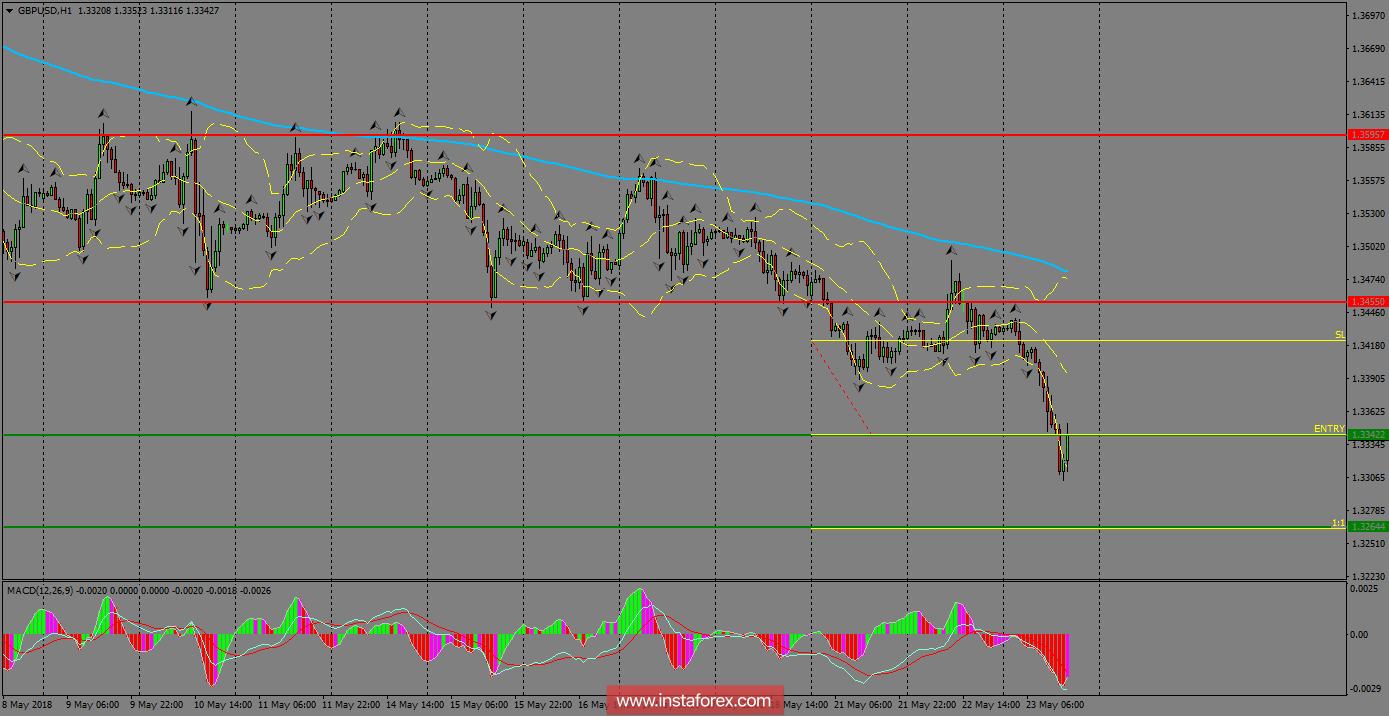
GBP/USD was smashed on Wednesday following the UK CPI data released on an annual basis. There is an ongoing breakout below the support level of 1.3342, which is the last hurdle ahead of the 1.3264 level. However, we cannot discard a possible rebound at the current stage in order to correct the current cycle towards the 200 SMA on H1 chart.

H1 chart's resistance levels: 1.3455 / 1.3595
H1 chart's support levels: 1.3342 / 1.3264
Trading recommendations for today: Based on the H1 chart, sell (short) orders only if the GBP/USD pair breaks a bullish candlestick; the resistance level is at 1.3342, take profit is at 1.3264 and stop loss is at 1.3421 English
 Русский
 Bahasa Indonesia
 Bahasa Malay
 ไทย
ไทย Español
 Deutsch
 Български
 Français
 Tiếng Việt
 中文
中文 বাংলা
বাংলা हिन्दी
 Čeština
 Українська
 Română

