Another bunch of economic data from the US was published yesterday. Industrial production in April increased by 0.7% m/m (an increase of 0.6% was expected). Capacity utilization amounted to 78% (versus expected 78.4%). Data on a started construction of houses and permits for their construction showed that 3.7% fewer construction projects were started in April (an increase of 0.4% was expected) and 1.8% fewer permits were issued (a 2.4% drop was expected). On Wednesday, Wall Street could show that Tuesday's slumps in the indexes were just an accident at work, and players slowly get used to a higher than 3% yield on ten-year bonds. It would be a strong signal to buy shares. Of course, the alternative was the continuation of the correction. It turned out that the bulls still in control of the market, despite the fact that they had a strong dollar against each other and still growing bond yields in an increasingly difficult geopolitical situation. And yet, the indexes grew. At the beginning of the session there was a lot of hesitation, but from her half the bulls definitely took the wheel into their own hands. The session ended with an increase in the SP500 index (0.41%).
Of course Wall Street did not react to what was happening in Europe. How could it react if indexes in Europe (especially in Germany) grew? It was quite strange to behave in a situation where ideas forming the new government in Italy, the Northern League and the 5 Stars Movement, overestimated the euro. These parties want, that the ECB should give them EUR 250 billion which they bought from the market within QE. The idea is so absurd that it's probably why traders on European stock exchanges have not reacted. Only the index on the Italian stock market was losing. Other European investors, however, should also react because such an Italian government could lead to turbulence worse than what the Donald Trump administration does.
In conclusion, Tuesday's decline was definitely no sign of a longer fall in indices. The global investors seem to get used to high bond yields and a strong dollar. It is said that the bull market continues when the indexes climb the wall of fear. It seems that this is the situation we are seeing.
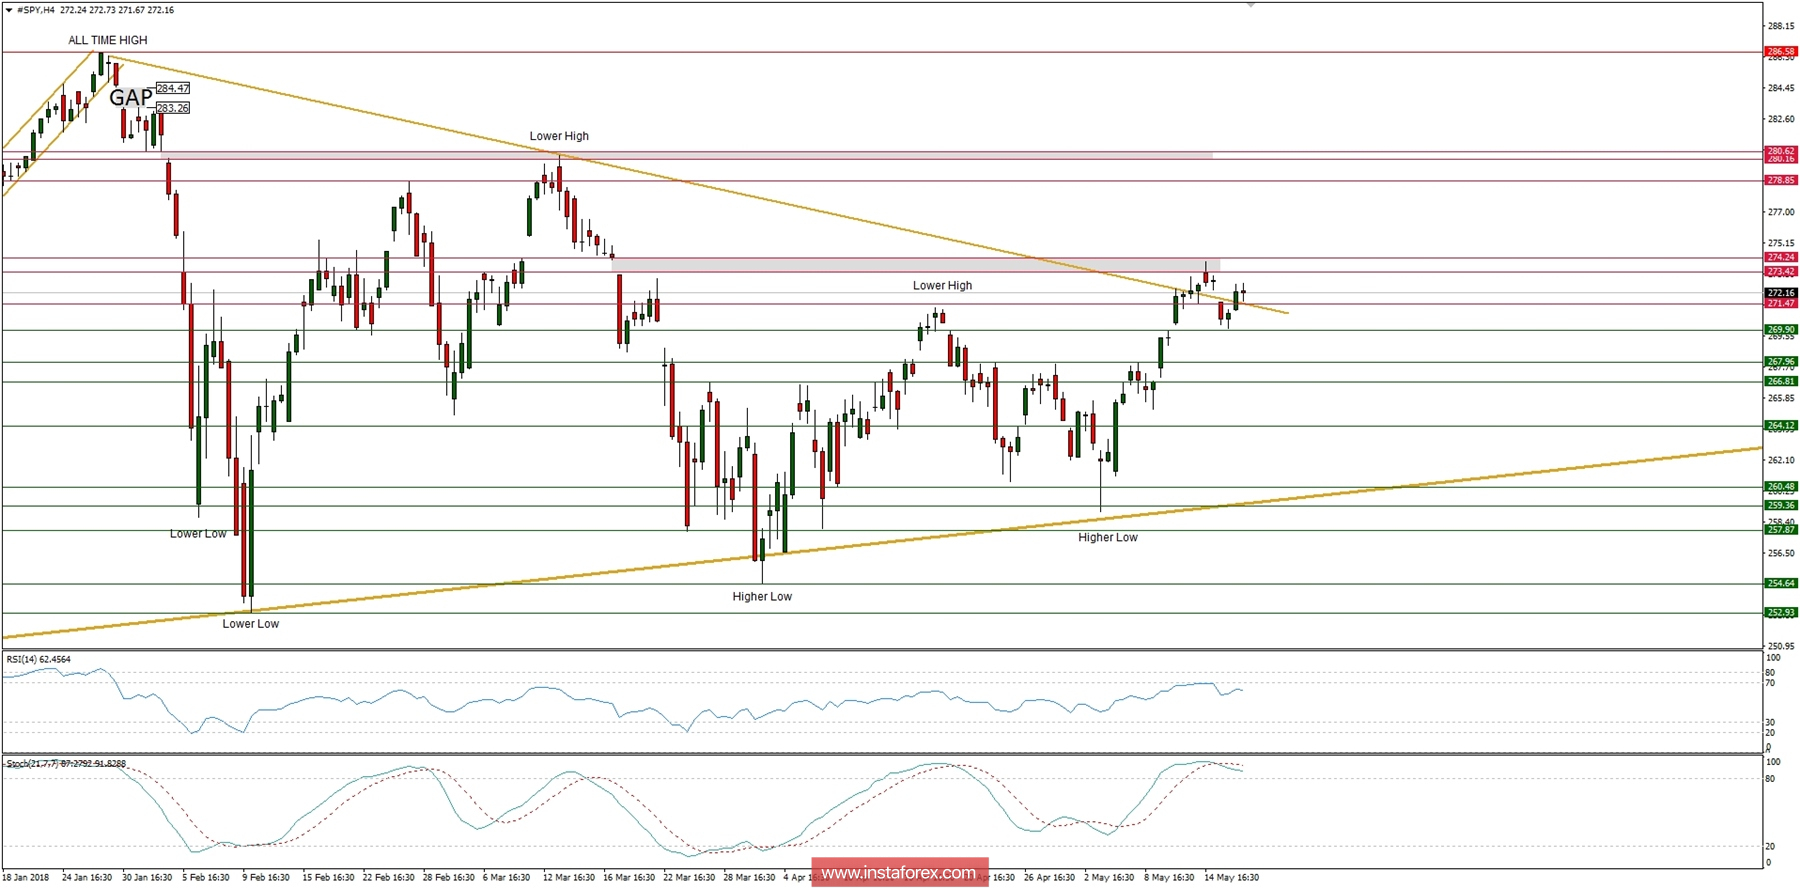
Let's now take a look at the SP500 technical picture at the H4 timeframe. The market has hit the technical resistance at the level of 274.20 and today's the price has gaped down towards the level of 269.87. The high at the level of 274.20 might be considered as a new higher high and any breakout above this level would lead to the test of the next technical resistance at the level of 278.85. Nevertheless, the market conditions are now overbought, so a temporary pull-back towards the level of 267.96 would be a good move before another wave up will take place.

 English
 Русский
 Bahasa Indonesia
 Bahasa Malay
 ไทย
ไทย Español
 Deutsch
 Български
 Français
 Tiếng Việt
 中文
中文 বাংলা
বাংলা हिन्दी
 Čeština
 Українська
 Română

