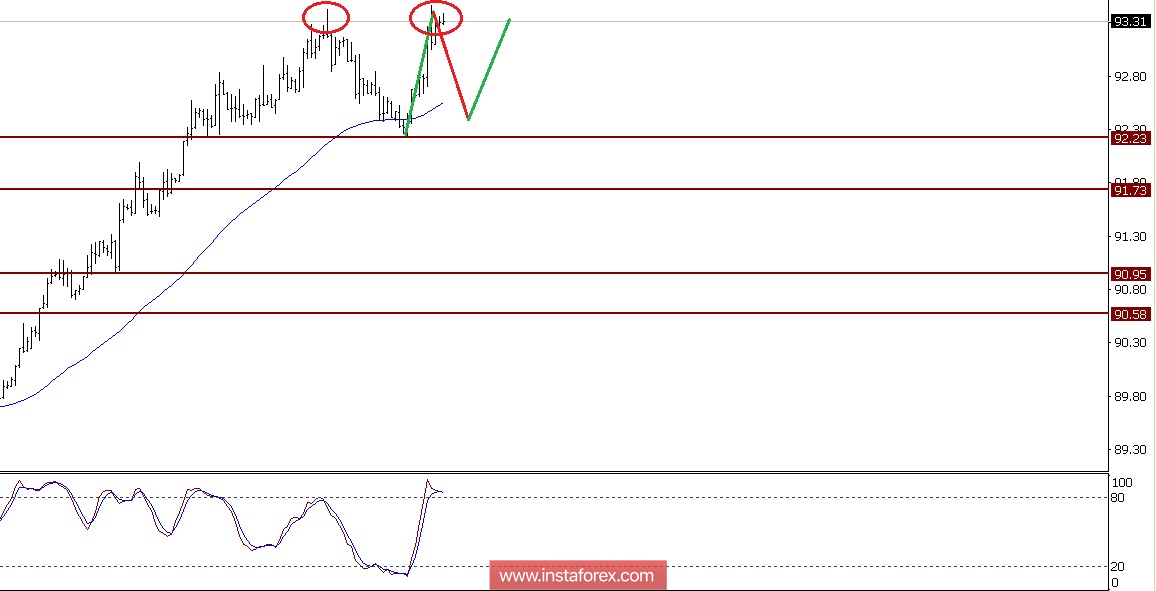
This is the USD Index after making a Double Top Formation on the 4-hour chart (see the red circle). Now it is going to test the support level at 92.23 or at near the Exponential Moving Average periode 62. As long as the price correction is not more then 91.73, there is a high probability the price will be back to the upside again at the previous resistance of 93.46.
 English
 Русский
 Bahasa Indonesia
 Bahasa Malay
 ไทย
ไทย Español
 Deutsch
 Български
 Français
 Tiếng Việt
 中文
中文 বাংলা
বাংলা हिन्दी
 Čeština
 Українська
 Română

