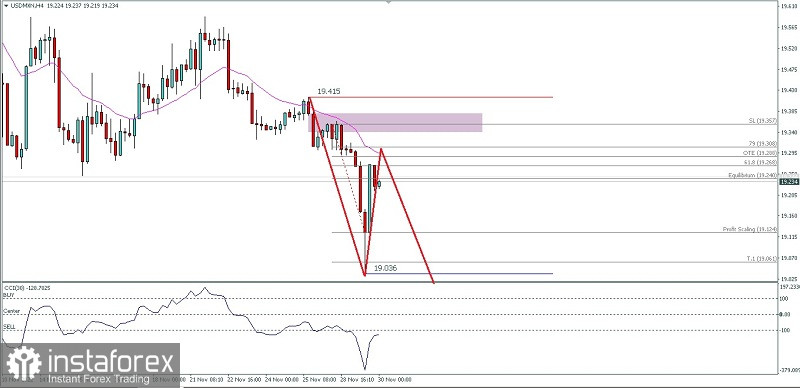
With price movements moving below the Moving Average of the 100 period and the CCI indicator still moving in the range of 0 to -100 levels on the 4-hour chart, the condition of the USD/MXN currency pair is confirmed to be still moving in a bearish bias while currently an upward correction is occurring. stuck at the Resistance level 19,268-19,240 if this level area is strong to hold the upward correction rate and does not exceed the 19,390 level then USD/MXN will have the potential to fall again down to the 19,036 level.
(Disclaimer)
 English
 Русский
 Bahasa Indonesia
 Bahasa Malay
 ไทย
ไทย Español
 Deutsch
 Български
 Français
 Tiếng Việt
 中文
中文 বাংলা
বাংলা हिन्दी
 Čeština
 Українська
 Română

