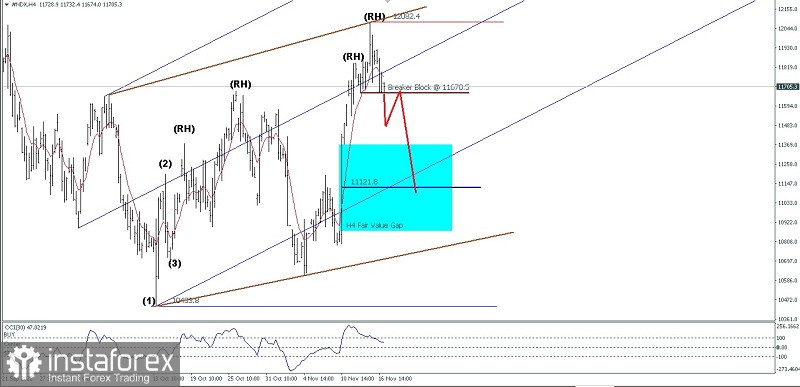
On 4 hour chart Nasdaq 100 Index seems visible if #NDX still moving within its Bullish Pitchfork channel even so because of its failure to touch the top line of the Bullish Pitchfork channel it can be considered as Hagopian Rules which confirms that in the near future #NDX will depreciated in the near future where it is also confirmed by the emergence of the Ascending Broadening Wedge pattern so that in the near future #NDX will try to test and broke below the level 11670,5 if this level is successfully broken then #NDX has the potential to fall to 11121.8 as the main target and 10789.1 as the next target to be tested with a note that on its way to the target level it does not return to its initial bias (Bull) until it exceeds above 12082. because if this level is successfully broken, it is very likely that the downside scenario described above will become invalid.
(Disclaimer)
 English
 Русский
 Bahasa Indonesia
 Bahasa Malay
 ไทย
ไทย Español
 Deutsch
 Български
 Français
 Tiếng Việt
 中文
中文 বাংলা
বাংলা हिन्दी
 Čeština
 Українська
 Română

