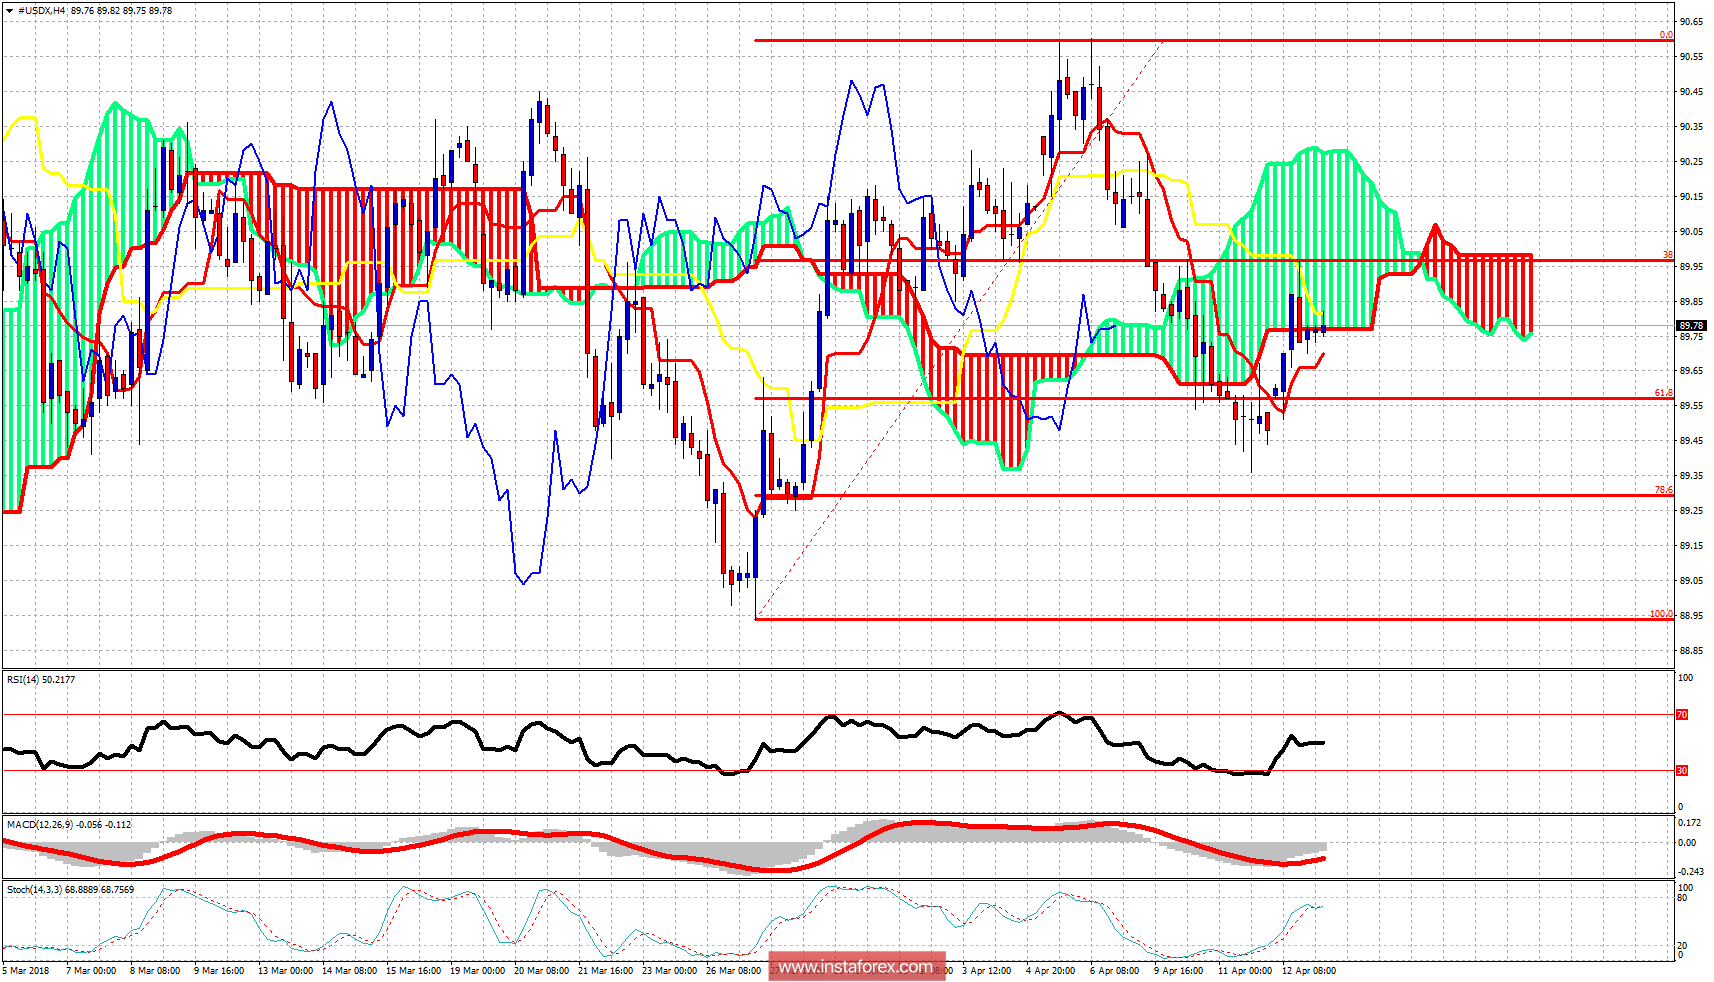
The Dollar index as expected bounced off the 61.8% Fibonacci retracement and reached the important resistance level of 90, but could not break above it and change the trend. The price got rejected and pushed back towards the lower cloud boundary. Bears remain in control of the trend as long as we are below 90.

The weekly candle is back above the weekly tankan-sen and so there are the hopes of bulls for a move towards 91.70. A weekly close above 89.60 is good for bulls. A weekly close above 90.30 would be an even better sign. Bears, on the other hand, need to see the price move below 89.35 and not above 90. What the price is going to do is very unclear for the short-term. Keep those price levels in mind for a clearer directional hint.
 English
 Русский
 Bahasa Indonesia
 Bahasa Malay
 ไทย
ไทย Español
 Deutsch
 Български
 Français
 Tiếng Việt
 中文
中文 বাংলা
বাংলা हिन्दी
 Čeština
 Українська
 Română

