As we warned last week, the Dollar index was testing resistance at 90.30 where the cloud was found and got rejected. Price is still above the March lows. Bears remain in control.
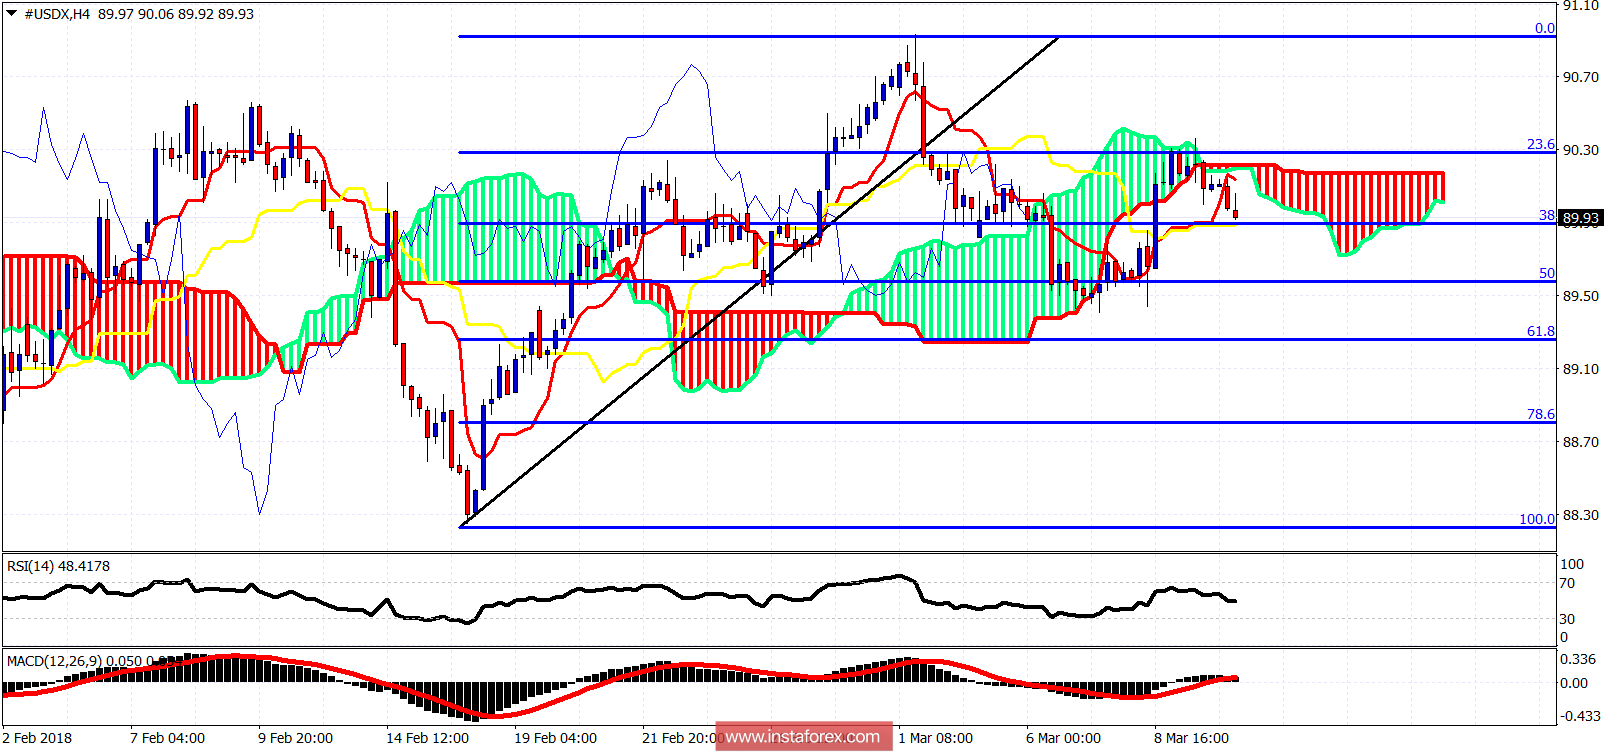
Price is below the Ichimoku cloud. Resistance remains at 90.30. Support is at 89.40. A break below it will push price towards 88.30. Trend remains bearish in the short-term. A new break above the Ichimoku cloud will be a bullish sign and could push the index towards 91.
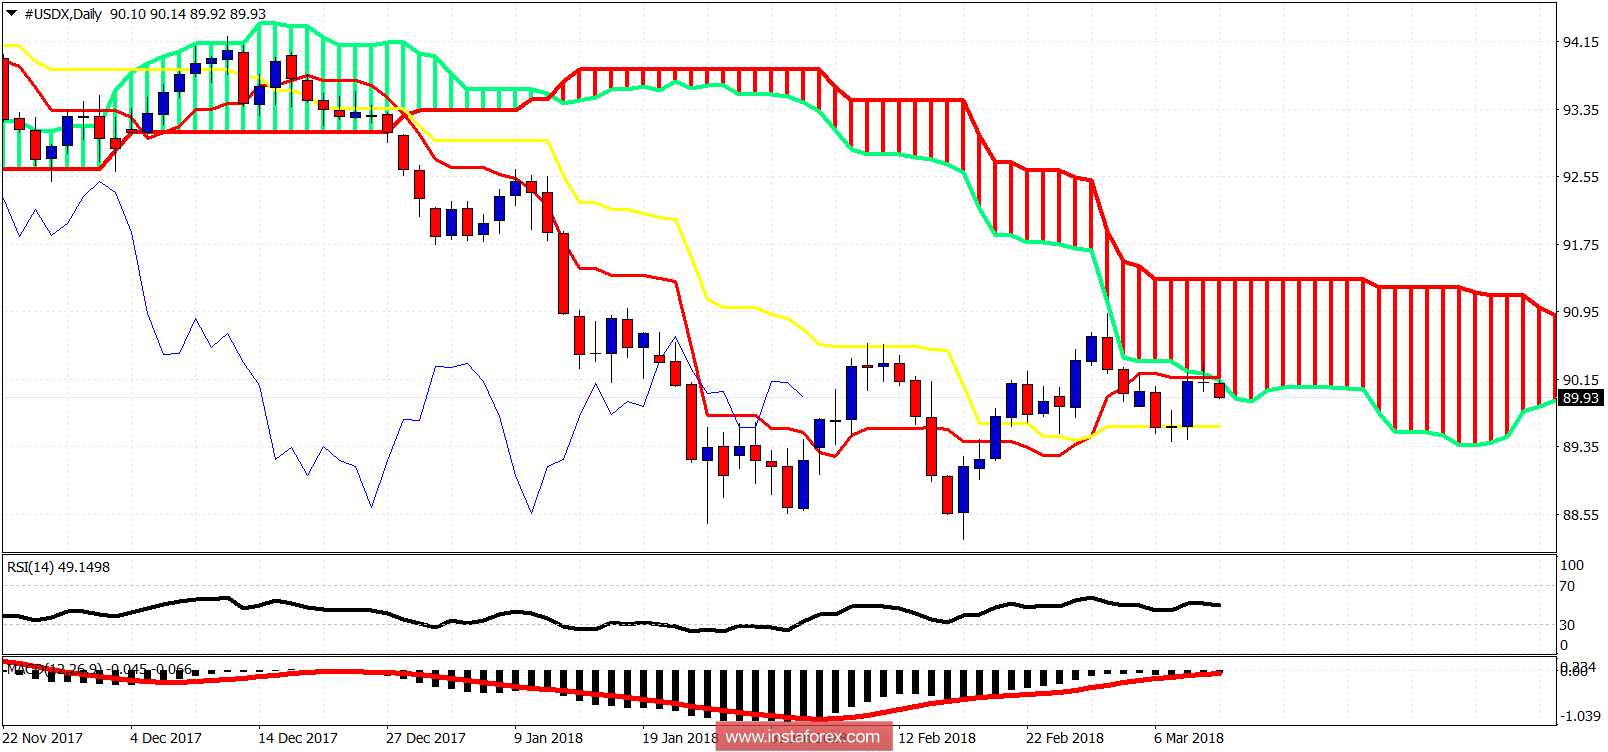
On a daily basis the Dollar index is getting rejected at the Daily cloud resistance. Support is at Friday's lows where we also find the kijun-sen (yellow line indicator). Daily trend remains bearish as price is below the Kumo. A break and daily close above the lower cloud boundary would be a bullish sign.
*The market analysis posted here is meant to increase your awareness, but not to give instructions to make a trade
 English
  Русский
 Bahasa Indonesia
 Bahasa Malay
 ไทย
ไทย Español
 Deutsch
 Български
 Français
 Tiếng Việt
 中文
中文 বাংলা
বাংলা हिन्दी
 Čeština
 Українська
 Română
 Long-term review