 English
  Русский
 Bahasa Indonesia
 Bahasa Malay
 ไทย
ไทย Español
 Deutsch
 Български
 Français
 Tiếng Việt
 中文
中文 বাংলা
বাংলা हिन्दी
 Čeština
 Українська
 Română

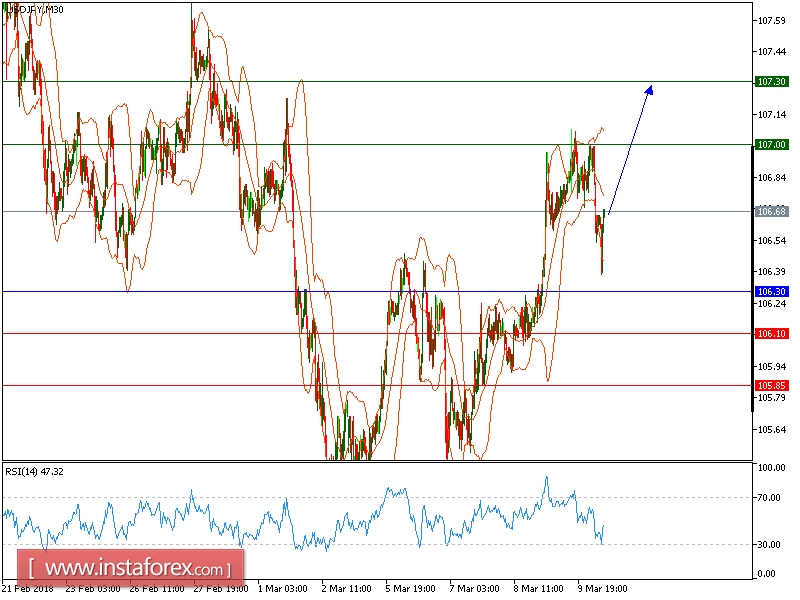
USD/JPY is expected to prevail its upside movement. The pair keeps trading on the upside and striking against the upper Bollinger band. It is currently at levels above the 20-period moving average. And the ascending 50-period moving average is helping to maintain intraday bullishness. Upward momentum is also evidenced by the relative strength index, which is well directed in the 60s. On the upside, the pair should target 107.00 and 107.30 (last seen at end-February). Key support is located at 106.30, losing which would open a path toward 106.10 on the downside.
Chart Explanation: The black line shows the pivot point. The current price above the pivot point indicates a bullish position, while the price below the pivot point is a signal for a short position. The red lines show the support levels, and the green line indicates the resistance level. These levels can be used to enter and exit trades.
Strategy: BUY, stop loss at 106.30, take profit at 107.00.
Resistance levels: 107.00, 106.80, and 107.15
Support levels: 106.10, 105.85, and 105.50.