 English
  Русский
 Bahasa Indonesia
 Bahasa Malay
 ไทย
ไทย Español
 Deutsch
 Български
 Français
 Tiếng Việt
 中文
中文 বাংলা
বাংলা हिन्दी
 Čeština
 Українська
 Română

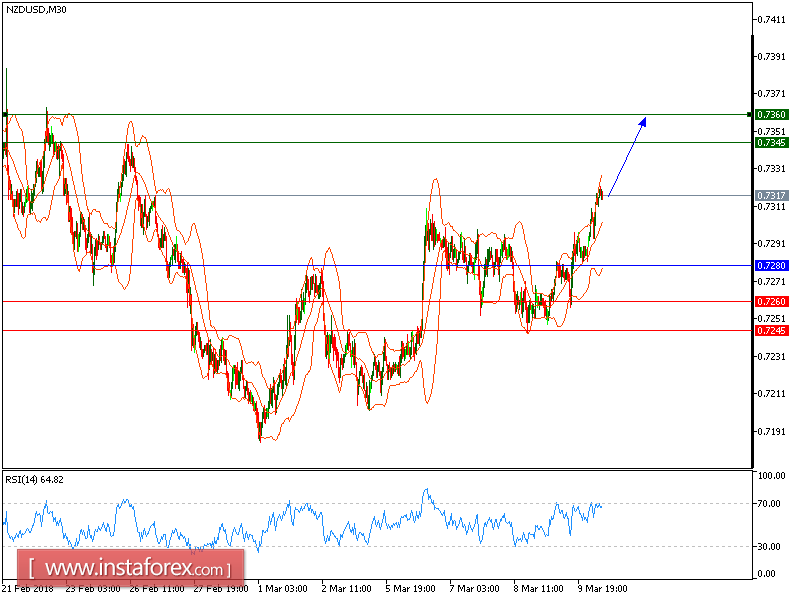
NZD/USD is expected to trade with bullish outlook. The pair is trading within the bullish channel, which confirmed a positive outlook. The upward momentum is further reinforced by both rising 20-period and 50-period moving averages. The relative strength index calls for a new upleg.
Hence, as long as 0.7280 holds on the downside, look for a further advance with targets at 0.7345 and 0.7360 in extension.
The black line shows the pivot point. Currently, the price is above the pivot point which is a signal for long positions. If it remains below the pivot point, it will indicate short positions. The red lines show the support levels, while the green line indicates the resistance levels. These levels can be used to enter and exit trades.
Resistance levels: 0.7345, 0.7360, and 0.7400.
Support levels: 0.7260, 0.7245, and 0.7215.