 English
  Русский
 Bahasa Indonesia
 Bahasa Malay
 ไทย
ไทย Español
 Deutsch
 Български
 Français
 Tiếng Việt
 中文
中文 বাংলা
বাংলা हिन्दी
 Čeština
 Українська
 Română

The pair holds the support zone of 1.3753 following a sell-off seen in the last few days. The 200 SMA could act as a dynamic resistance that helps to cap further gains in the Cable across the board. If that happens, a pullback is expected to happen in order to resume the bearish bias toward the 1.3608 level. MACD indicator stays in the positive territory.
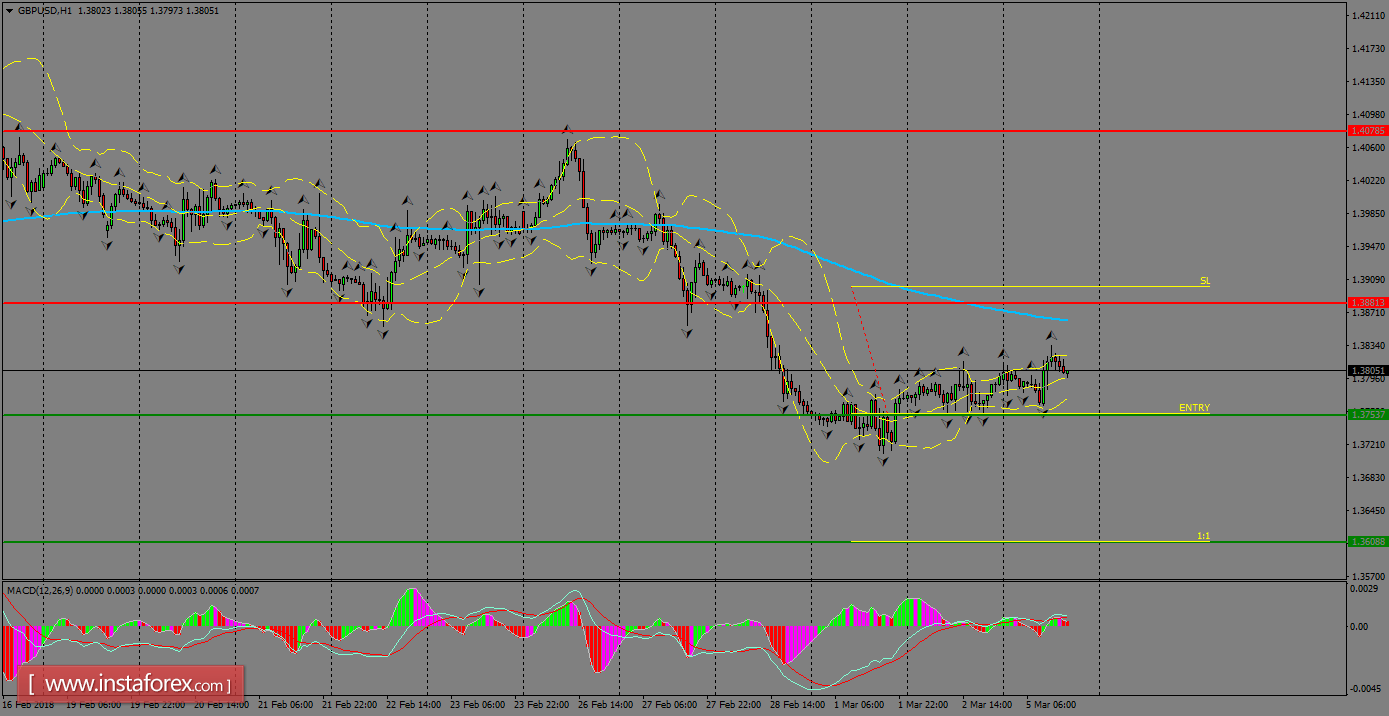
H1 chart's resistance levels: 1.3881 / 1.4078
H1 chart's support levels: 1.3753 / 1.3608
Trading recommendations for today: Based on the H1 chart, sell (short) orders only if the GBP/USD pair breaks a bearish candlestick; the resistance level is at 1.3753, take profit is at 1.3608 and stop loss is at 1.3901.