 English
  Русский
 Bahasa Indonesia
 Bahasa Malay
 ไทย
ไทย Español
 Deutsch
 Български
 Français
 Tiếng Việt
 中文
中文 বাংলা
বাংলা हिन्दी
 Čeština
 Українська
 Română

The Dollar index is trading above the 4-hour Ichimoku cloud. Price reached the cloud support and bounced. Support is being respected. Short-term trend remains bullish.
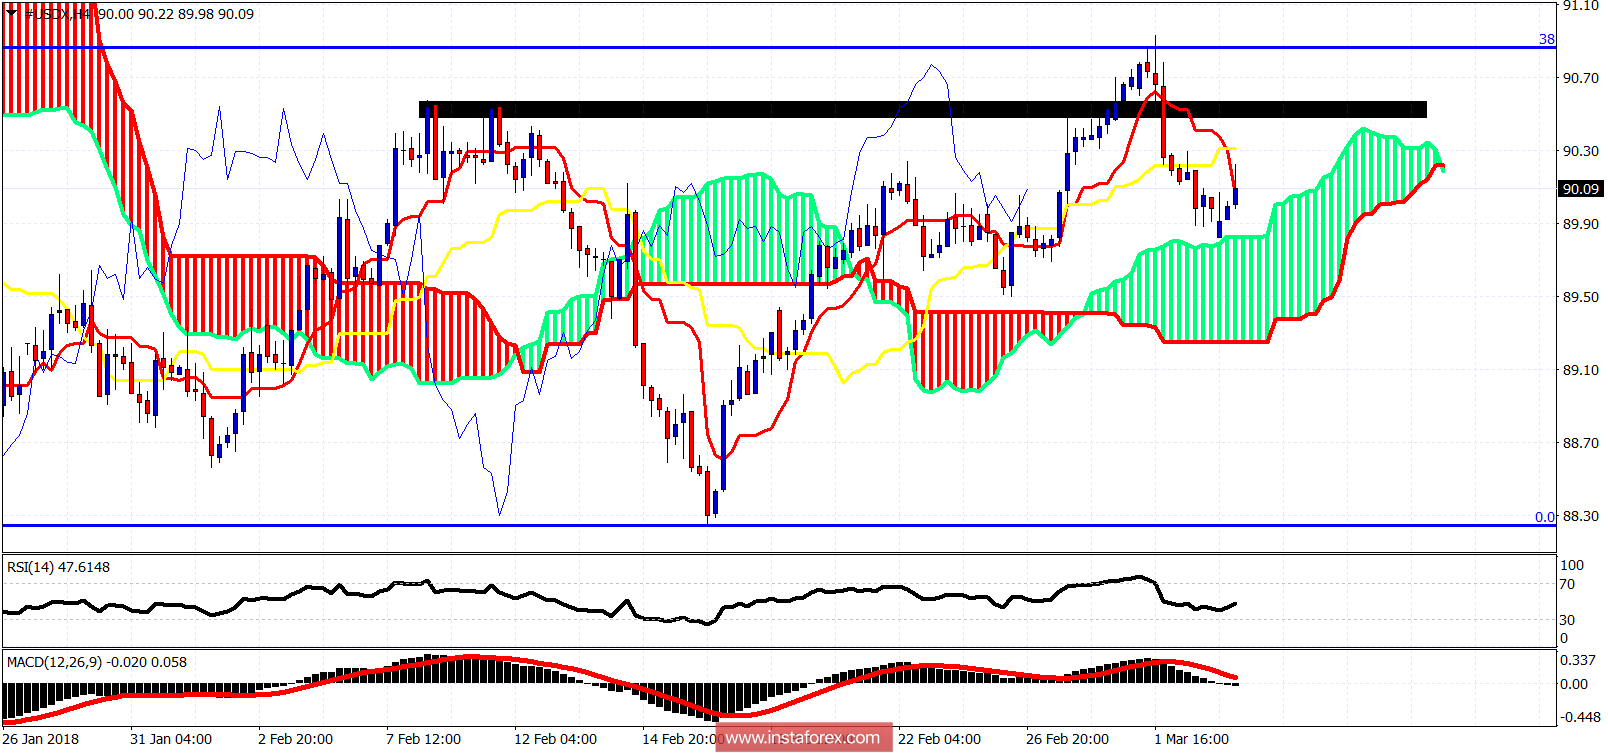
Black rectangle - resistance
The Dollar index is above the Ichimoku cloud in the 4-hour chart but below both the tenkan- and the kijun-sen indicators. Support is at 89.80. Resistance is at 90.30. A 4-hour close above 90.30 will increase the chances of a move above the black rectangular resistance area.
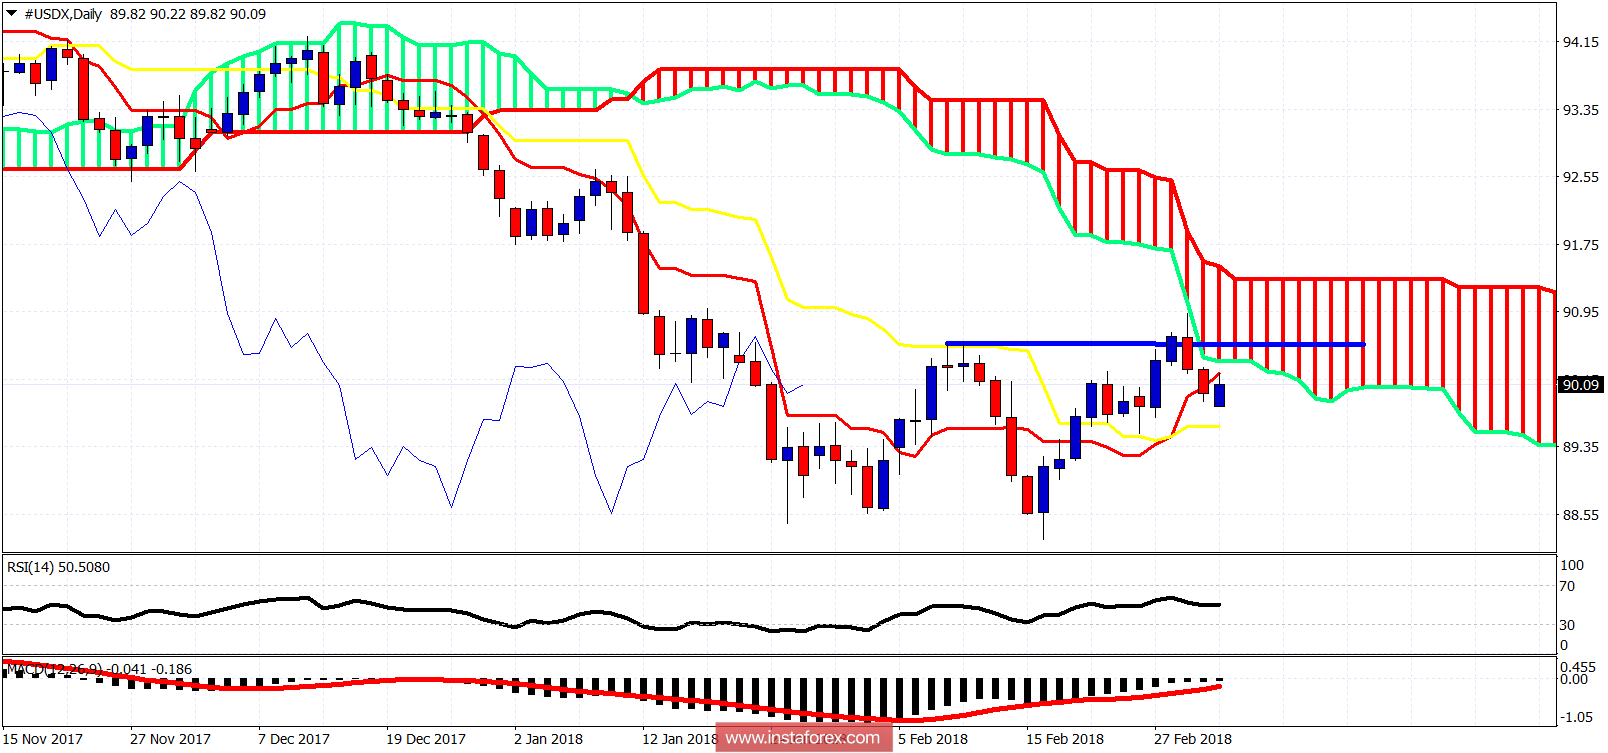
On a daily basis the Dollar index got rejected last week at the Ichimoku cloud. Price is above the daily kijun-sen support at 89.60. A daily close below it will be a sign of weakness. On the other hand if bulls manage to break above 90.35 on a daily closing basis, trend will change to neutral and the chances for a move towards 91.30 will increase.