 English
  Русский
 Bahasa Indonesia
 Bahasa Malay
 ไทย
ไทย Español
 Deutsch
 Български
 Français
 Tiếng Việt
 中文
中文 বাংলা
বাংলা हिन्दी
 Čeština
 Українська
 Română

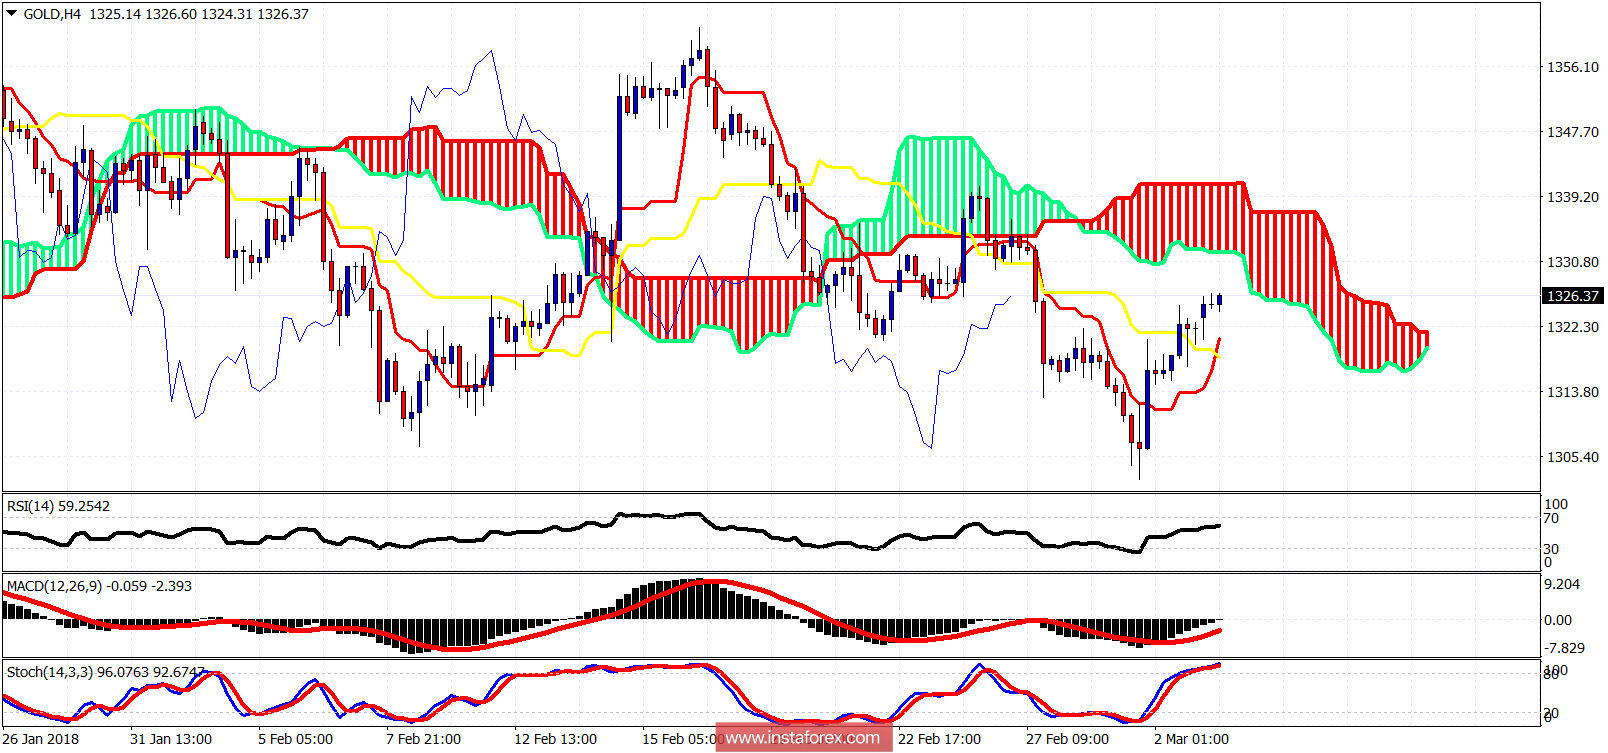
The Gold price is still trading below the Ichimoku cloud in the 4hour chart. The trend remains bearish. Important short-term resistance is just above $1,330. Bulls need to break it in order to continue to the bounce higher.
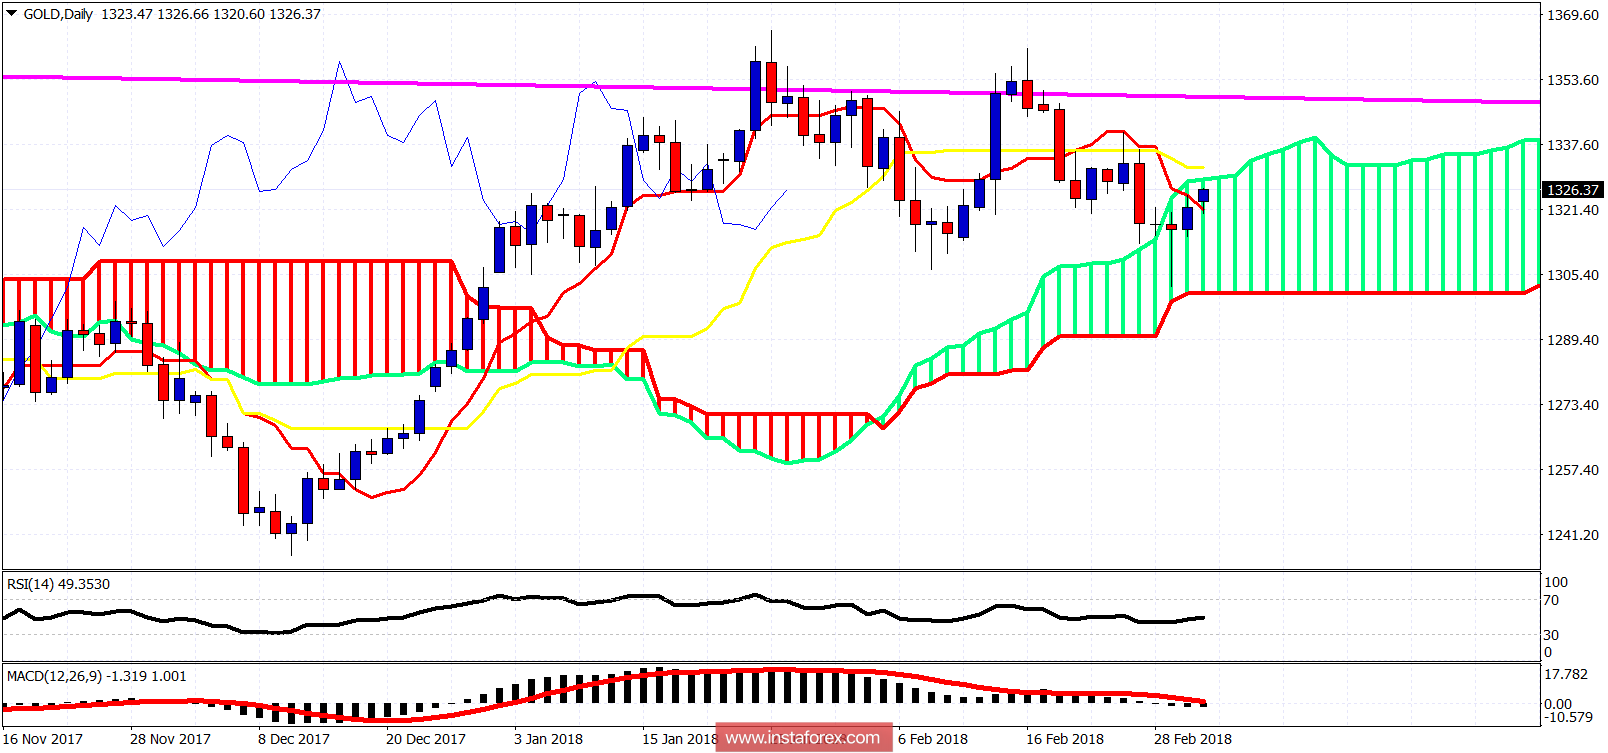
Magenta line - long-term resistance
The Gold price in the Daily chart remains inside the Kumo. The trend is neutral. Resistance is at the upper cloud boundary at $1,330-31. Support is at $1,300. As long as the price is above $1,300 and below $1,331 I prefer to be neutral or sell near resistance or buy near support. A break of either level will turn me bearish or bullish respectively.