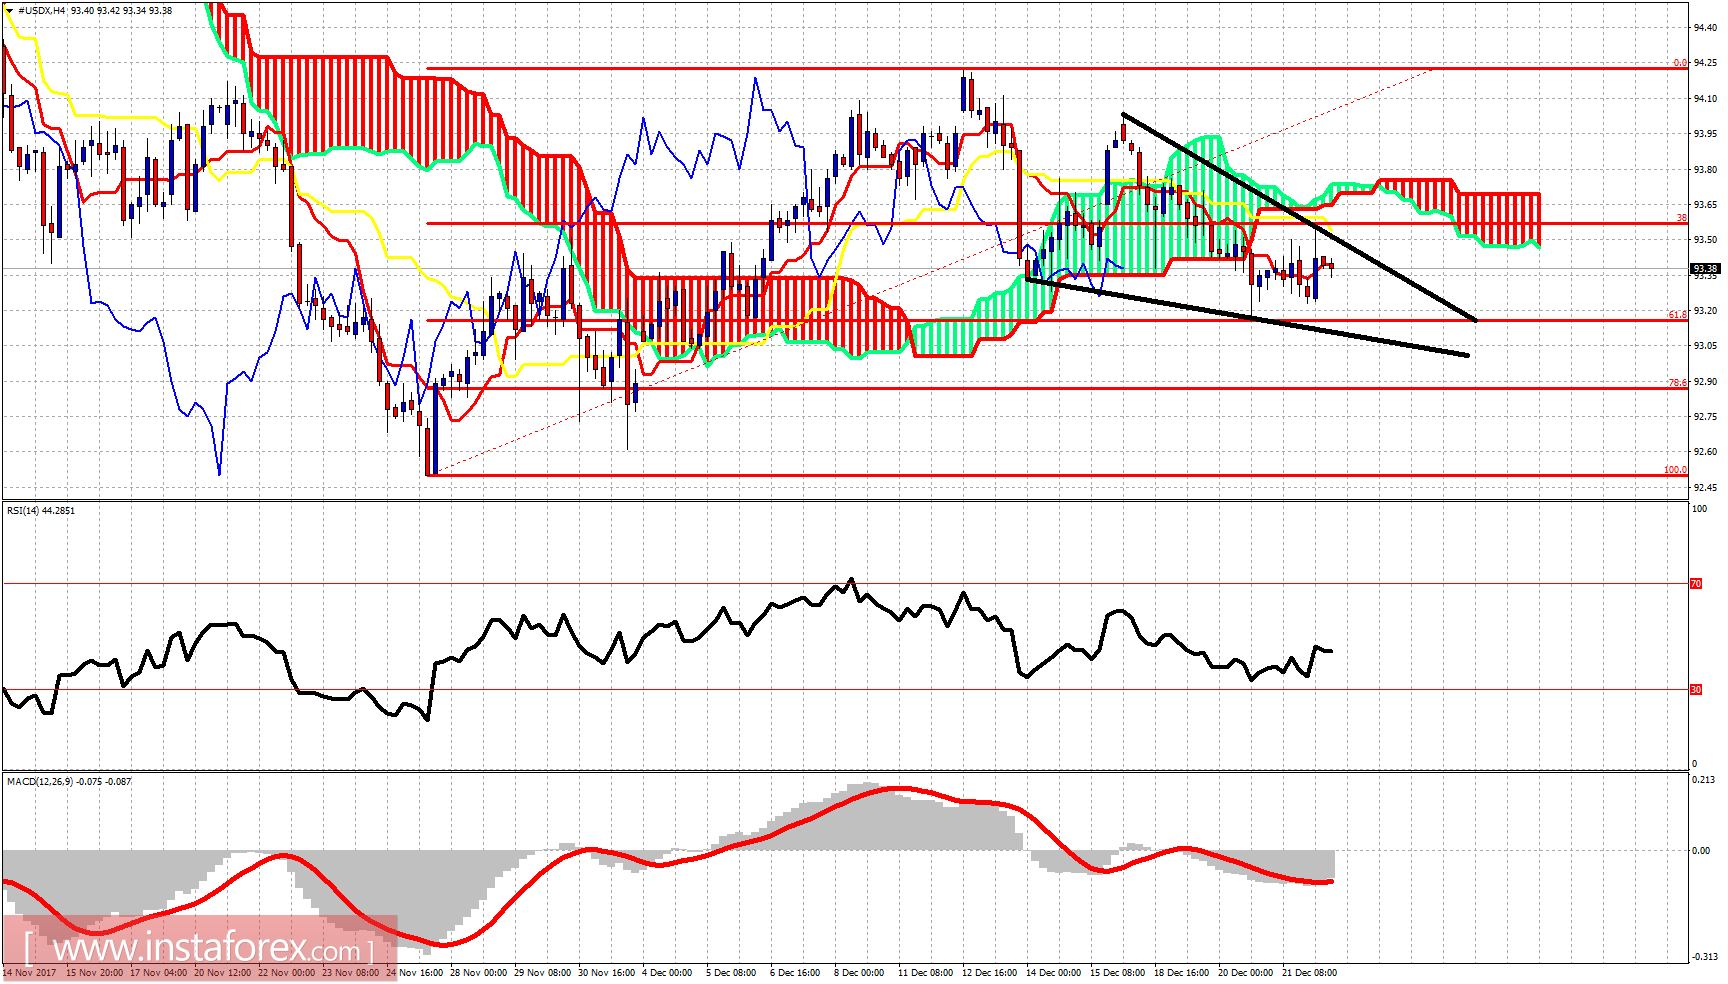
The Dollar index tried to bounce and resume the up trend yesterday but got rejected at the cloud resistance and remains inside a downward sloping triangle, what is most probably a bullish wedge pattern.

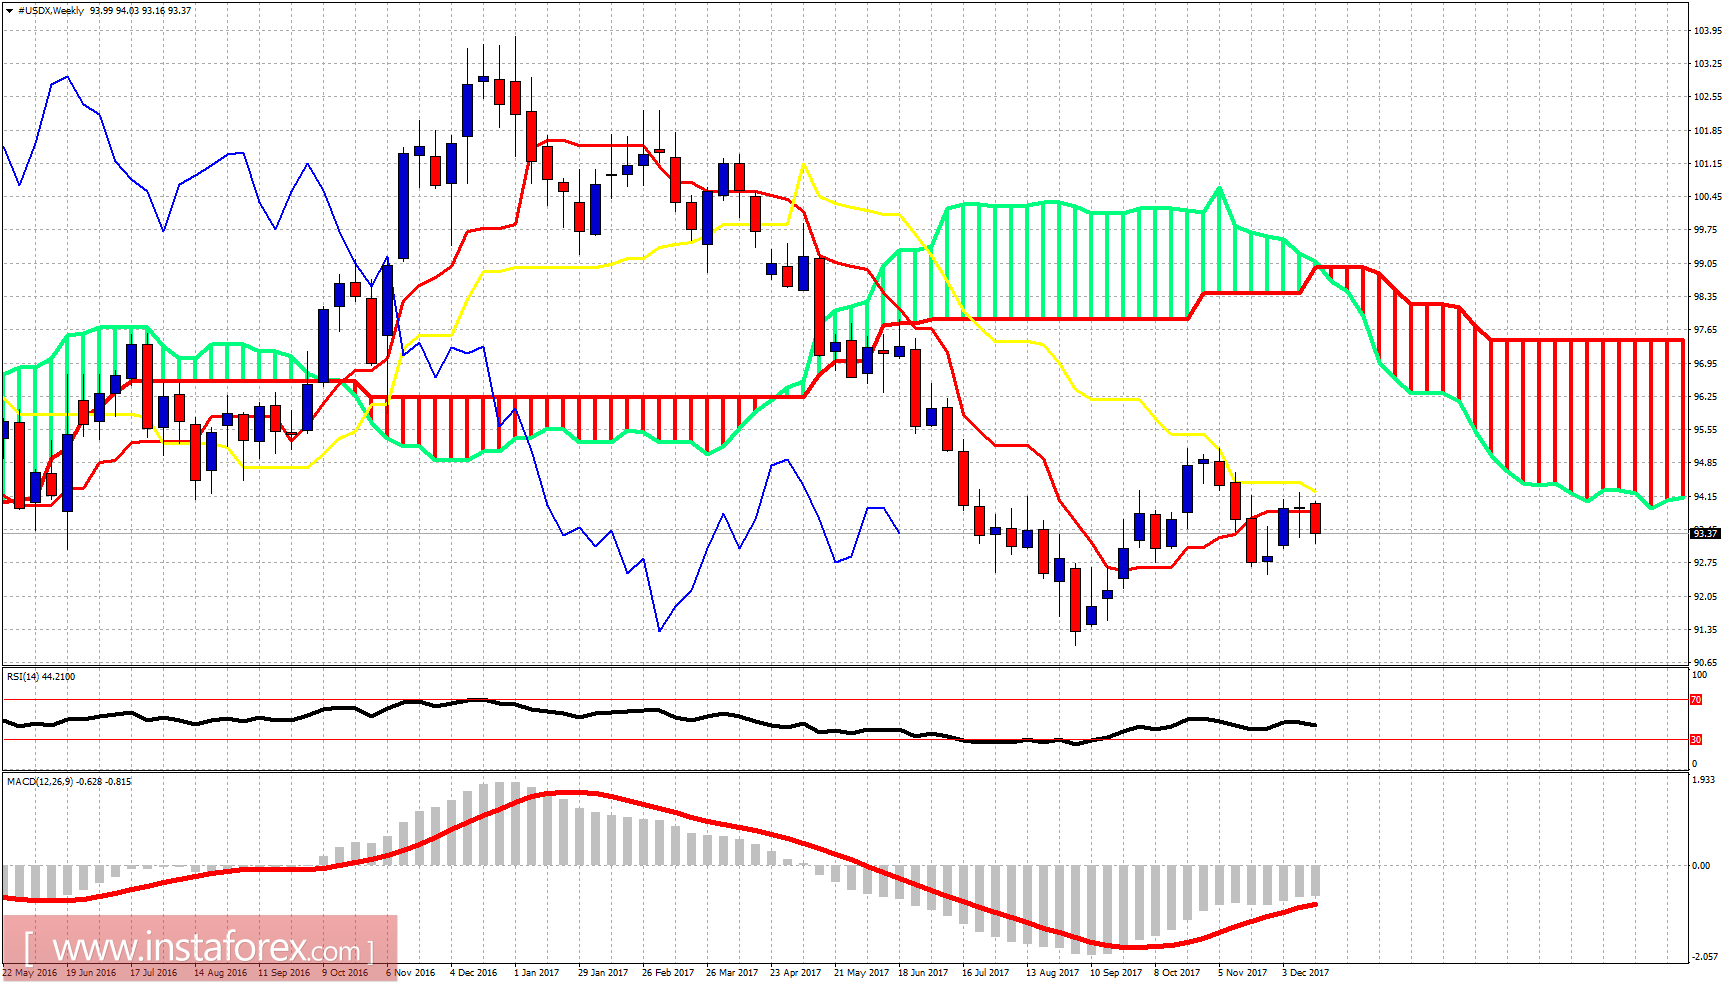
Trend remains bearish as price is making lower lows and lower highs. Price bounced yesterday towards cloud resistance but got rejected. Price remains below the 4-hour cloud and this is not good for bulls. Support is at 93.15-93. Resistance is at 93.50-93.60. Important resistance that will change trend to bullish is at 93.80.

 English
 Русский
 Bahasa Indonesia
 Bahasa Malay
 ไทย
ไทย Español
 Deutsch
 Български
 Français
 Tiếng Việt
 中文
中文 বাংলা
বাংলা हिन्दी
 Čeština
 Українська
 Română

