 English
  Русский
 Bahasa Indonesia
 Bahasa Malay
 ไทย
ไทย Español
 Deutsch
 Български
 Français
 Tiếng Việt
 中文
中文 বাংলা
বাংলা हिन्दी
 Čeština
 Українська
 Română

The index remains supported by the 93.30 level and waits for a fresh catalyst that decides the next path for the short-term. The 200 SMA at the H1 chart is providing the path to USDX and it seems we can expect further bearish moves. If that level gives up, it's likely to see a decline towards the 92.83 level. MACD indicator is in the positive territory, favoring to the bulls.
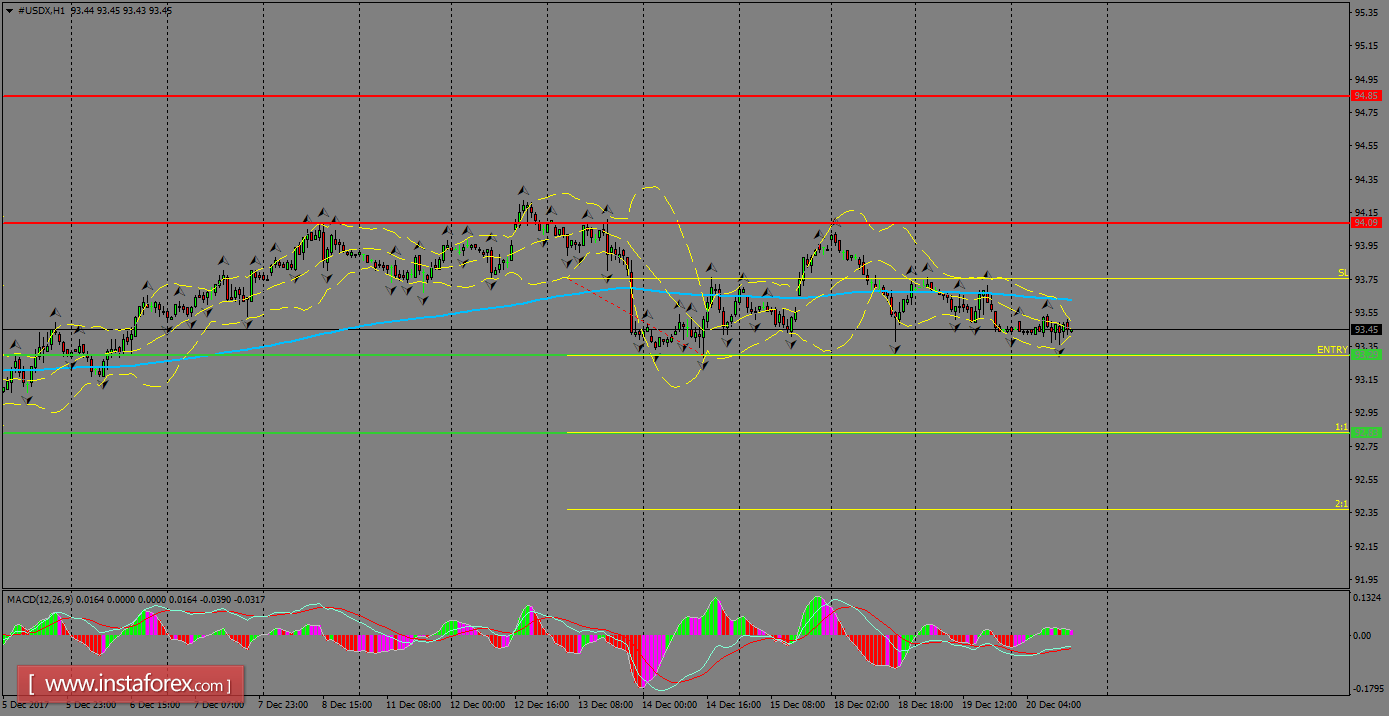
H1 chart's resistance levels: 94.09 / 94.85
H1 chart's support levels: 93.30 / 92.83
Trading recommendations for today: Based on the H1 chart, place sell (short) orders only if the USD Index breaks with a bearish candlestick; the support level is at 93.30, take profit is at 92.83 and stop loss is at 93.76.