 English
  Русский
 Bahasa Indonesia
 Bahasa Malay
 ไทย
ไทย Español
 Deutsch
 Български
 Français
 Tiếng Việt
 中文
中文 বাংলা
বাংলা हिन्दी
 Čeština
 Українська
 Română

The pair continues to trade inside a narrow range around the 200 SMA at H1 chart and it's now targeting the resistance zone of 1.3444. If it manages to pierce such hurdle, the next target lies at 1.3516, at which the bears could be waiting to push lower to the GBP/USD pair. MACD indicator remains in favor of the bulls.
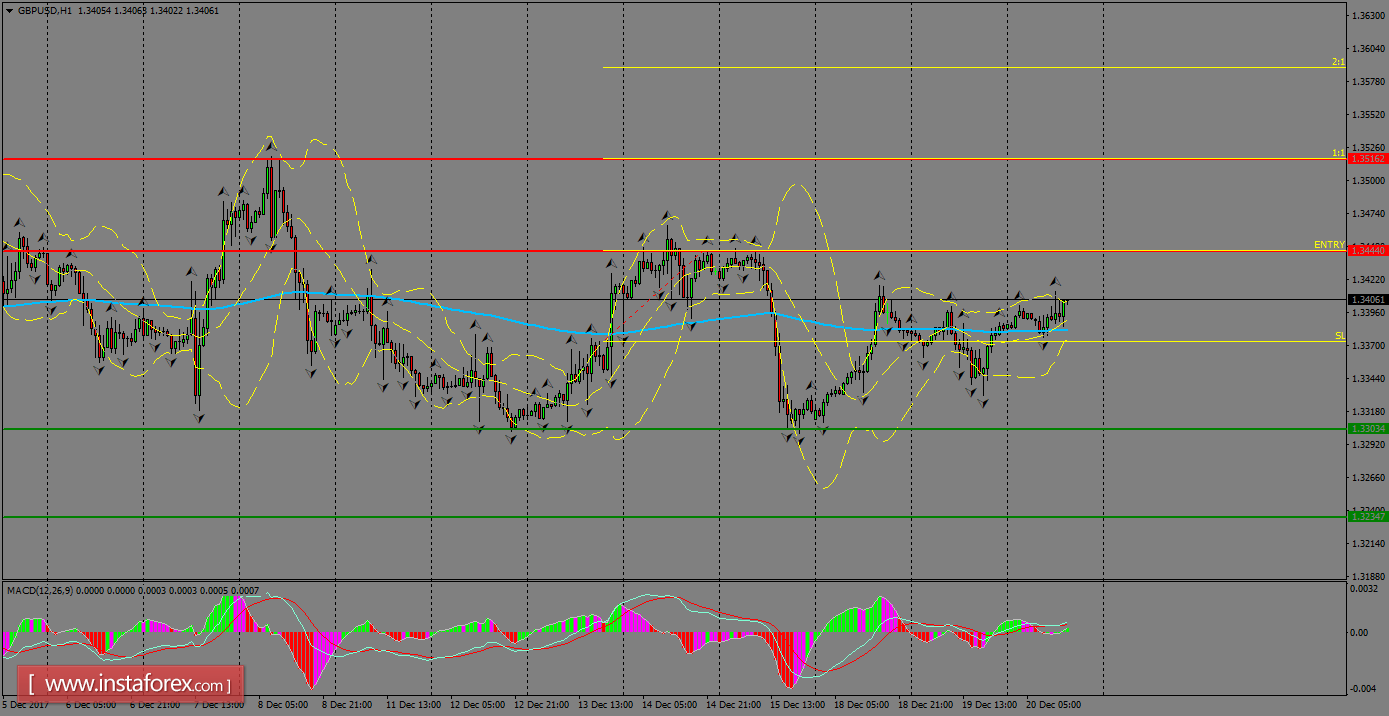
H1 chart's resistance levels: 1.3444 / 1.3516
H1 chart's support levels: 1.3303 / 1.3234
Trading recommendations for today: Based on the H1 chart, buy (long) orders only if the GBP/USD pair breaks a bullish candlestick; the resistance level is at 1.3444, take profit is at 1.3516 and stop loss is at 1.3372.