English
  Русский
 Bahasa Indonesia
 Bahasa Malay
 ไทย
ไทย Español
 Deutsch
 Български
 Français
 Tiếng Việt
 中文
中文 বাংলা
বাংলা हिन्दी
 Čeština
 Українська
 Română

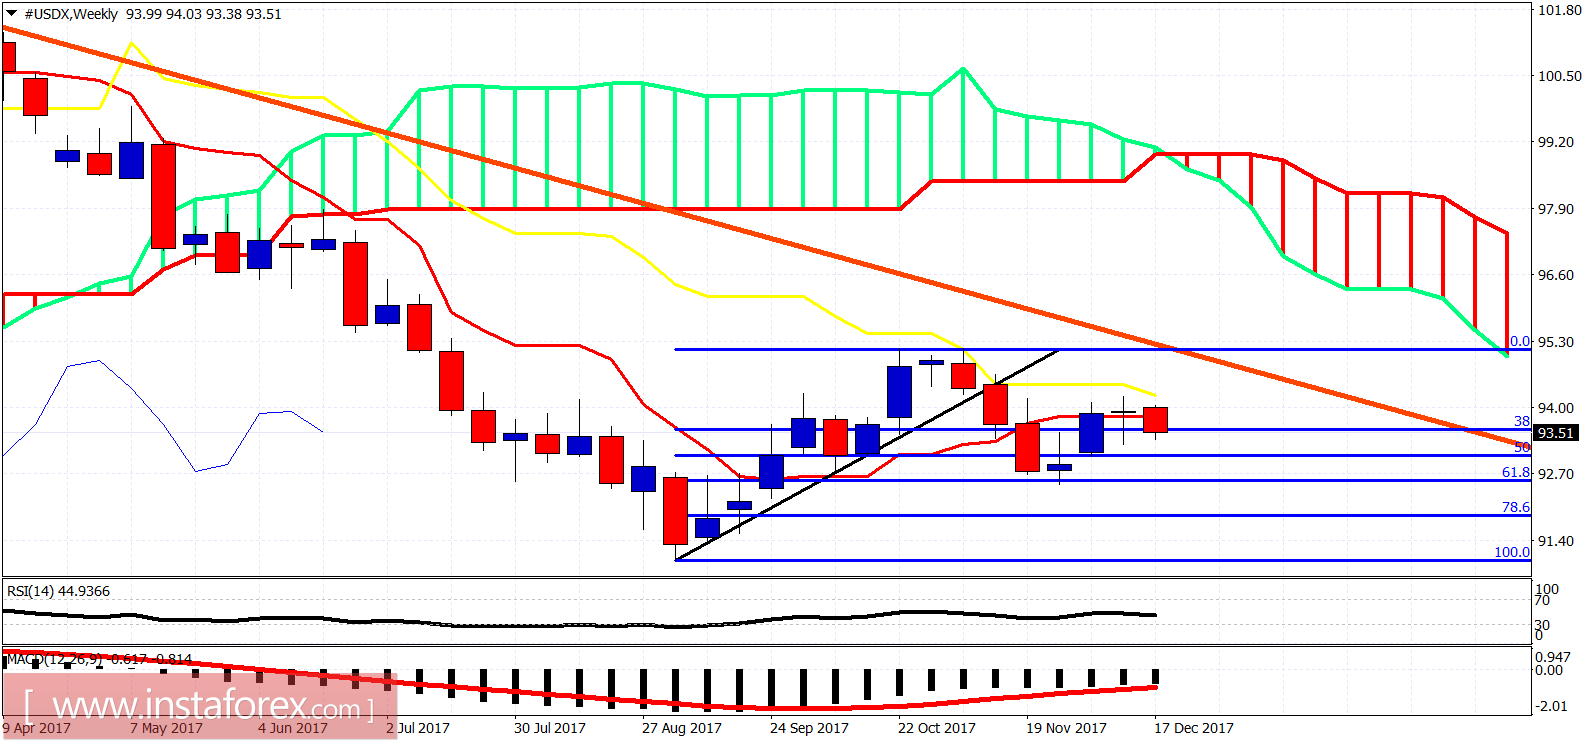
The Dollar index is testing important short-term cloud support at 93.30. Will it make a triple bottom and bounce? Trend crucial support is at 92.50-93. Breaching that level will be a bearish sign.
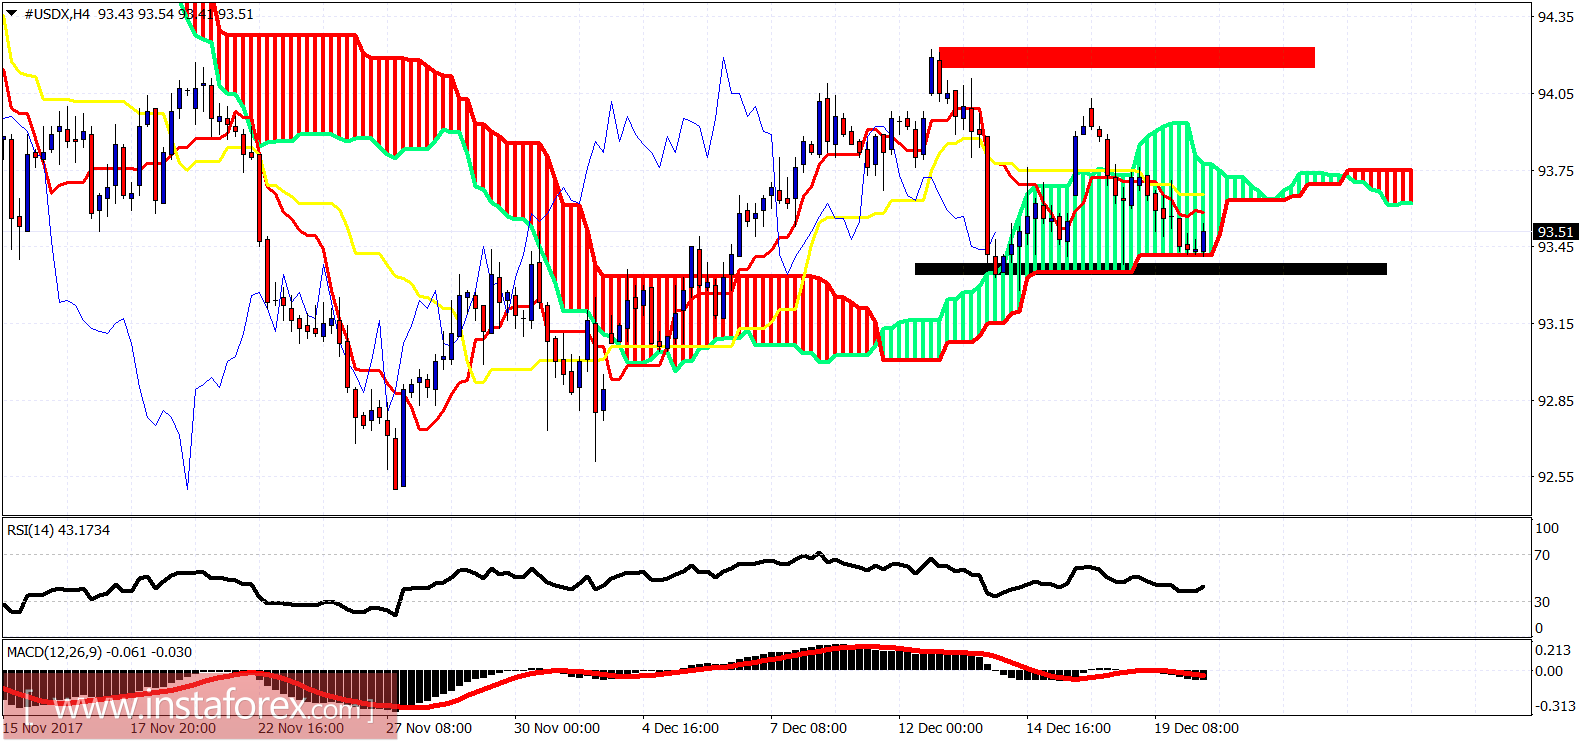
Black rectangle - support
The Dollar index is still trading inside the 4-hour Kumo. Trend is neutral. Price has respected so far the 93.30 support but bulls will need to show more signs of strength in order for the upward trend to resume. Resistance remains at 94-94.20. Shorter-term resistance is at 93.75 at the upper cloud boundary.