 中文
中文  Русский
 English
 Bahasa Indonesia
 Bahasa Malay
 ไทย
ไทย Español
 Deutsch
 Български
 Français
 Tiếng Việt
 বাংলা
বাংলা हिन्दी
 Čeština
 Українська
 Română

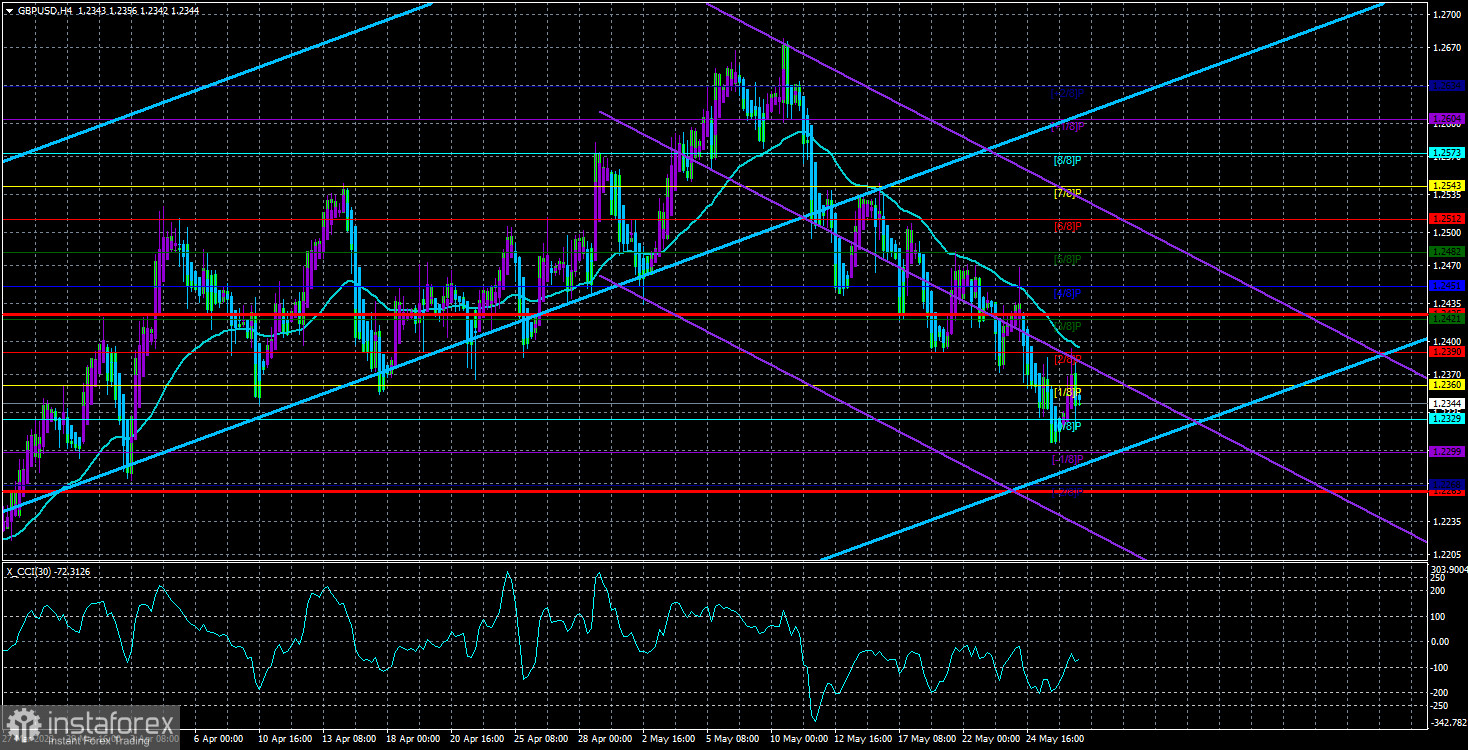
周五,GBP/USD货币对再次尝试向上调整,但未能成功。价格再次未能触及移动平均线,因此整体上看,向南的趋势仍然强劲。不幸的是,正如我们之前所说,目前在4小时时间框架上交易非常困难,因为趋势不是很强(尽管很稳定),而海龟阴影指标经常向上翻转。情况与欧元区大致相同。因此,最好的解决方案是进行中期交易。
现在对技术方面有什么可以说的吗?首先,它具有优先权。 我们长期以来一直观察到,货币对几乎没有基本基础和原因的增长,现在似乎会看到相反的情况。 如果是这样,那么任何宏观经济事件都可能被解释为支持美元,或者只会导致货币对微小的反弹。 值得提醒的是,英镑和欧元都被大量买入。 其次,在这种情况下,只有通过技术分析才能进行交易。 重要的新闻并不是每天都会出现,但货币对每天都在交易。 由于波动性现在不是最高的,因此在小时间框架上进行交易并不是非常明智。
在不久的将来,即使出现明显的上升修正并突破移动平均线,我们仍然建议卖出。假设英镑在上涨了2300点后可能回归上升趋势,这是非常困难的。在这方面,24小时的时间框架非常有帮助,需要仔细观察当前的下行趋势。最小的下跌目标是1.2170水平- 云图B线。
在新的一周里,英国几乎没有重要事件,因此所有的注意力都集中在美国的统计数据上。周一,美国和英国都没有任何事件。
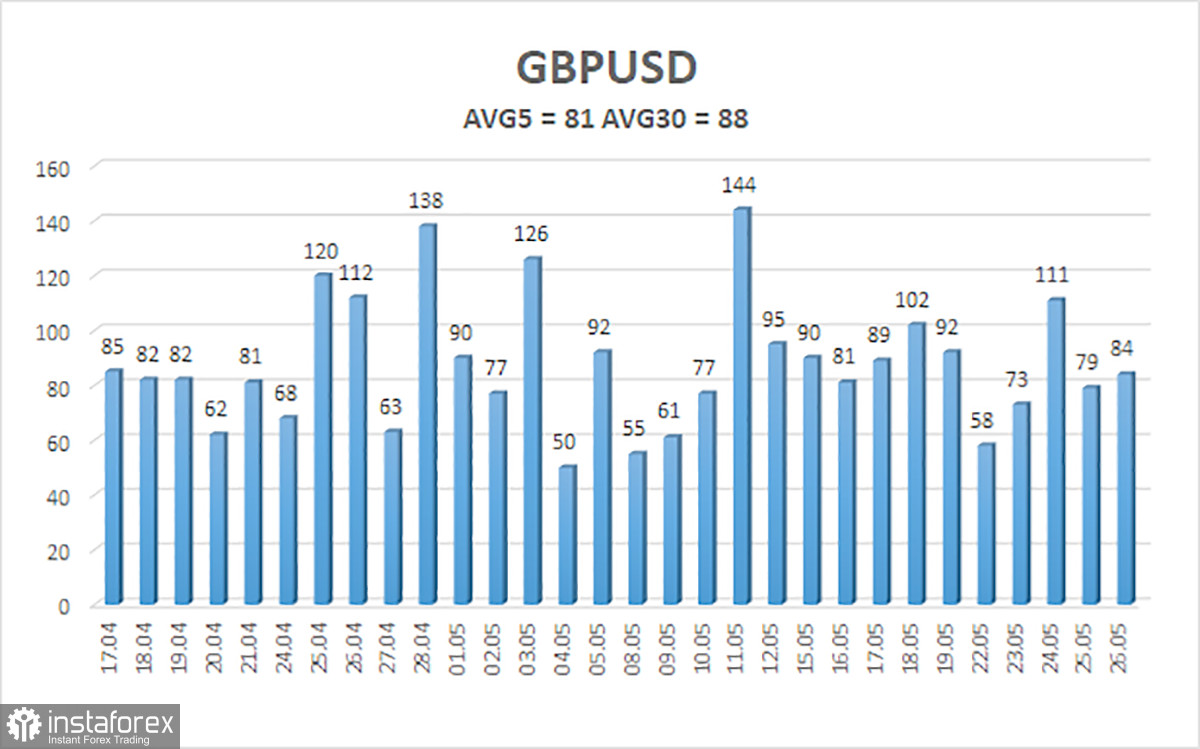
過去5個交易日,GBP/USD的平均波動率為81點。對於英鎊/美元這對貨幣來說,這個值是“中等”的。因此,我們預計在5月29日星期一,它將在1.2263和1.2425之間波動。如果Heiken Ashi指標反轉向上,這將標誌著修正行情的新一輪。
最近的支撐水平:
S1-1.2329
S2-1.2299
S3-1.2268
最近的阻力水平:
R1-1.2360
R2-1.2390
R3-1.2421
交易建議:
在4小時的時間框架內,GBP/USD總體上繼續向下走,因此短期持倉仍然有效,目標為1.2299和1.2263,直到價格穩定在移動平均線之上。如果價格穩定在移動平均線之上,可以考慮長期持倉,目標為1.2425和1.2451。
建議閱讀:
EUR/USD pair review. May 29. ECB is not going to abandon rate hikes.
Forecast and trading signals for EUR/USD on May 29. COT report. Detailed analysis of the pair's movement and trading deals.
Forecast and trading signals for GBP/USD on May 29. COT report. Detailed analysis of the pair's movement and trading deals.
Explanations for illustrations:
Linear regression channels - help determine the current trend. If both are directed in the same direction, the trend is currently strong.
Moving average line (settings 20,0, smoothed) - determines the short-term trend and direction in which trading should be conducted now.
Murray levels - target levels for movements and corrections.
Volatility levels (red lines) - the probable price channel in which the pair will spend the next day, based on current volatility indicators.
CCI indicator - its entry into the oversold area (below -250) or overbought area (above +250) means that a trend reversal is approaching in the opposite direction.