 English
  Русский
 Bahasa Indonesia
 Bahasa Malay
 ไทย
ไทย Español
 Deutsch
 Български
 Français
 Tiếng Việt
 中文
中文 বাংলা
বাংলা हिन्दी
 Čeština
 Українська
 Română
FX.co ★ Actual patterns. Technical analysis and trading recommendations

Technical Analysis Patterns
There is nothing more precious to a trader than an ability to predict a further price movement. Technical analysis is a key to your successful transaction. At the same time, you can rely on common and recurring situations that arise in the same circumstances. Our Technical Analysis Patterns section features all trading recommendations based on the technical analysis patterns that help traders make projections and turn a profit.
Instrument:
1 selected
#Bitcoin
EURCHF
EURGBP
EURJPY
EURUSD
EURCAD
EURRUB
EURNZD
USDCAD
USDCHF
USDJPY
USDRUB
NZDCAD
NZDUSD
NZDCHF
NZDJPY
AUDCAD
AUDCHF
AUDJPY
AUDUSD
GBPUSD
GBPJPY
GBPAUD
GBPCHF
GOLD
SILVER
#AAPL
#AMZN
#EBAY
#FB
#GOOG
#MCD
#MA
#KO
#INTC
#MSFT
#NTDOY
#PEP
#TSLA
#TWTR
Figure:
All
Triangle
Rectangle
Pennant
Flag
Head and Shoulders
Double Top
Triple top
Timeframe:
All
M5
M15
M30
H1
D1
Signal strength:
All
High
Medium
Low
Signal direction:
All
Buy
Sell
#Bitcoin
#Bitcoin M5
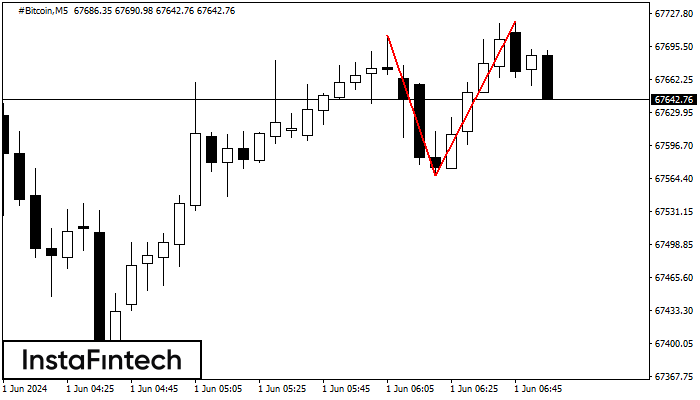
Double Top
The Double Top reversal pattern has been formed on #Bitcoin M5. Characteristics: the upper boundary 67706.42; the lower boundary 67567.32; the width of the pattern is 15295 points. Sell trades are better to be opened below the lower boundary 67567.32 with a possible movements towards the 67567.17 level.
#Bitcoin M5
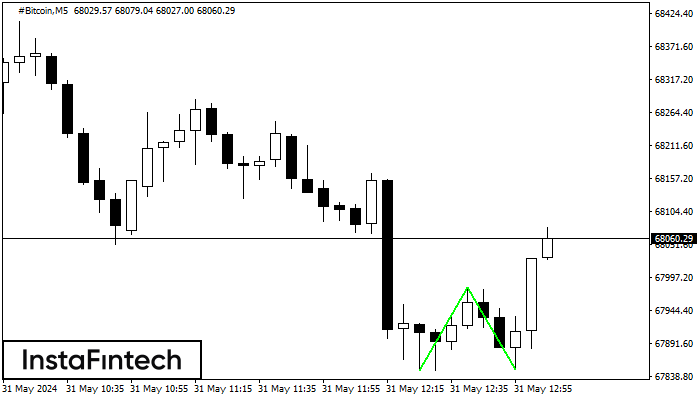
Double Bottom
The Double Bottom pattern has been formed on #Bitcoin M5; the upper boundary is 67981.84; the lower boundary is 67848.84. The width of the pattern is 13374 points. In case of a break of the upper boundary 67981.84, a change in the trend can be predicted where the width of the pattern will coincide with the distance to a possible take profit level.
#Bitcoin H1
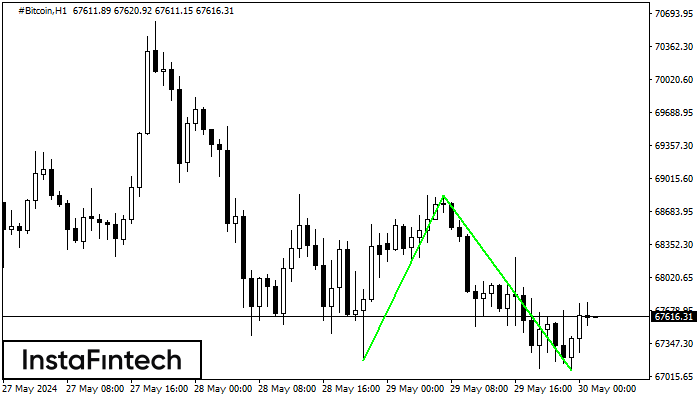
Double Bottom
The Double Bottom pattern has been formed on #Bitcoin H1. This formation signals a reversal of the trend from downwards to upwards. The signal is that a buy trade should be opened after the upper boundary of the pattern 68850.65 is broken. The further movements will rely on the width of the current pattern 168110 points.
#Bitcoin M30
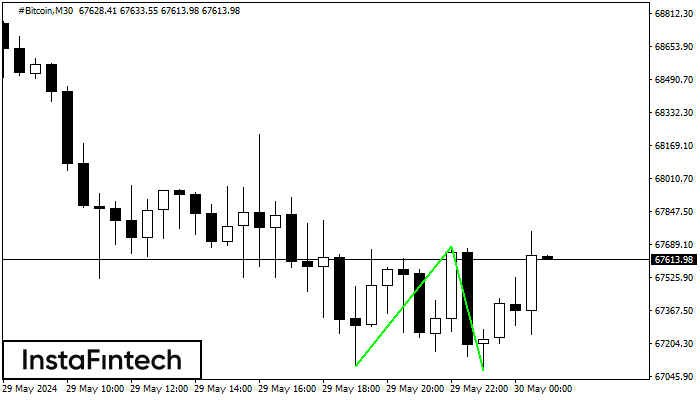
Double Bottom
The Double Bottom pattern has been formed on #Bitcoin M30. Characteristics: the support level 67090.23; the resistance level 67677.74; the width of the pattern 58751 points. If the resistance level is broken, a change in the trend can be predicted with the first target point lying at the distance of 60369 points.
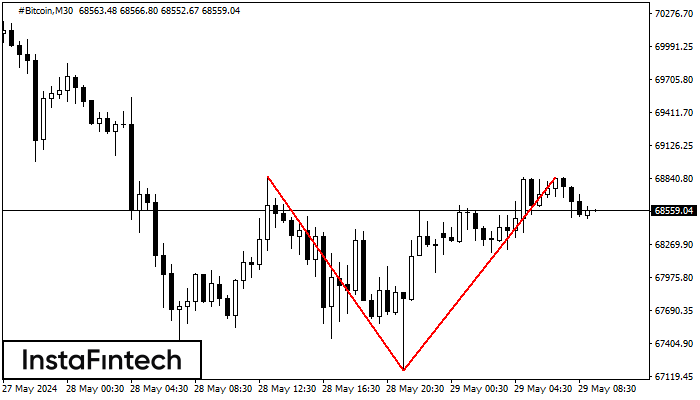
#Bitcoin M30
Double Top
The Double Top reversal pattern has been formed on #Bitcoin M30. Characteristics: the upper boundary 68855.59; the lower boundary 67169.55; the width of the pattern is 168110 points. Sell trades are better to be opened below the lower boundary 67169.55 with a possible movements towards the 67169.25 level.
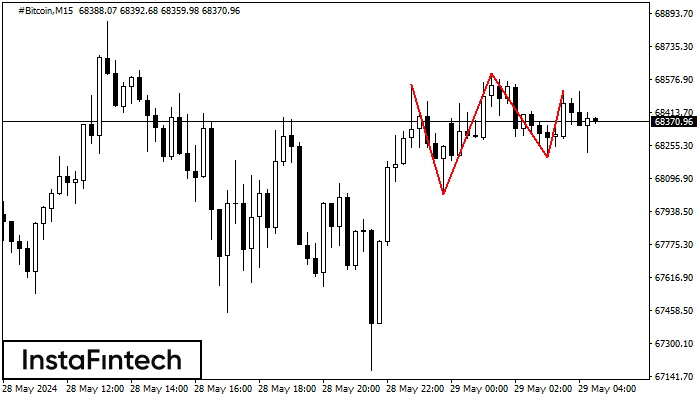
#Bitcoin M15
Triple Top
On the chart of the #Bitcoin M15 trading instrument, the Triple Top pattern that signals a trend change has formed. It is possible that after formation of the third peak, the price will try to break through the resistance level 68017.95, where we advise to open a trading position for sale. Take profit is the projection of the pattern’s width, which is 53179 points.
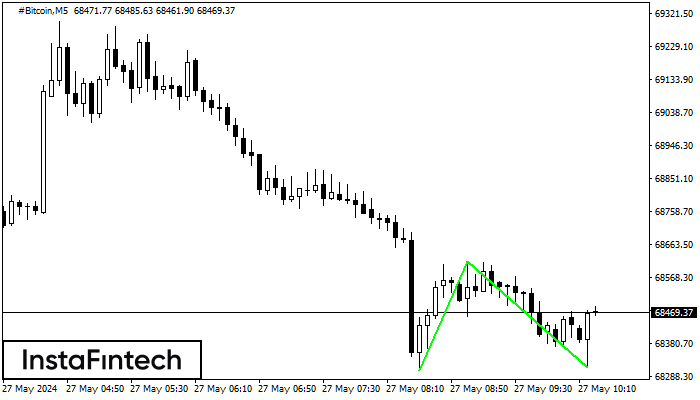
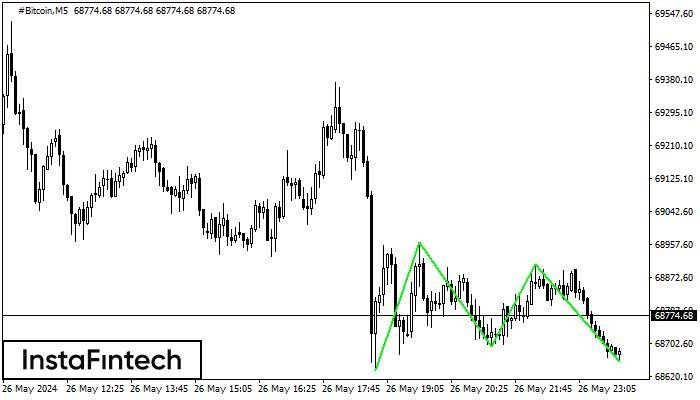
#Bitcoin M5
Double Bottom
The Double Bottom pattern has been formed on #Bitcoin M5. Characteristics: the support level 68304.86; the resistance level 68615.01; the width of the pattern 31015 points. If the resistance level is broken, a change in the trend can be predicted with the first target point lying at the distance of 30109 points.
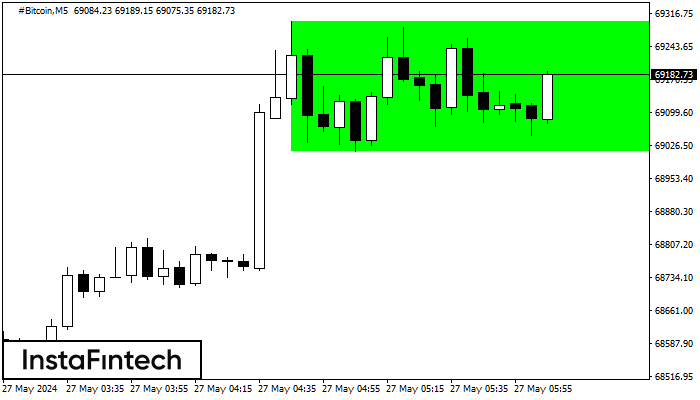
#Bitcoin M5
Bullish Rectangle
According to the chart of M5, #Bitcoin formed the Bullish Rectangle which is a pattern of a trend continuation. The pattern is contained within the following borders: the lower border 69012.52 – 69012.52 and upper border 69299.60 – 69299.60. In case the upper border is broken, the instrument is likely to follow the upward trend.
#Bitcoin M5
Triple Bottom
The Triple Bottom pattern has been formed on #Bitcoin M5. It has the following characteristics: resistance level 68961.27/68905.02; support level 68634.97/68658.33; the width is 32630 points. In the event of a breakdown of the resistance level of 68961.27, the price is likely to continue an upward movement at least to 68695.56.
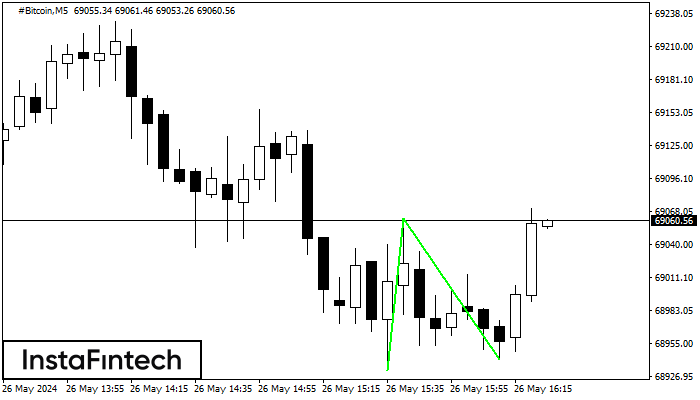
#Bitcoin M5
Double Bottom
The Double Bottom pattern has been formed on #Bitcoin M5. Characteristics: the support level 68931.90; the resistance level 69062.04; the width of the pattern 13014 points. If the resistance level is broken, a change in the trend can be predicted with the first target point lying at the distance of 12080 points.