 English
  Русский
 Bahasa Indonesia
 Bahasa Malay
 ไทย
ไทย Español
 Deutsch
 Български
 Français
 Tiếng Việt
 中文
中文 বাংলা
বাংলা हिन्दी
 Čeština
 Українська
 Română

Analyzing Thursday's trades:
GBP/USD on 1H chart
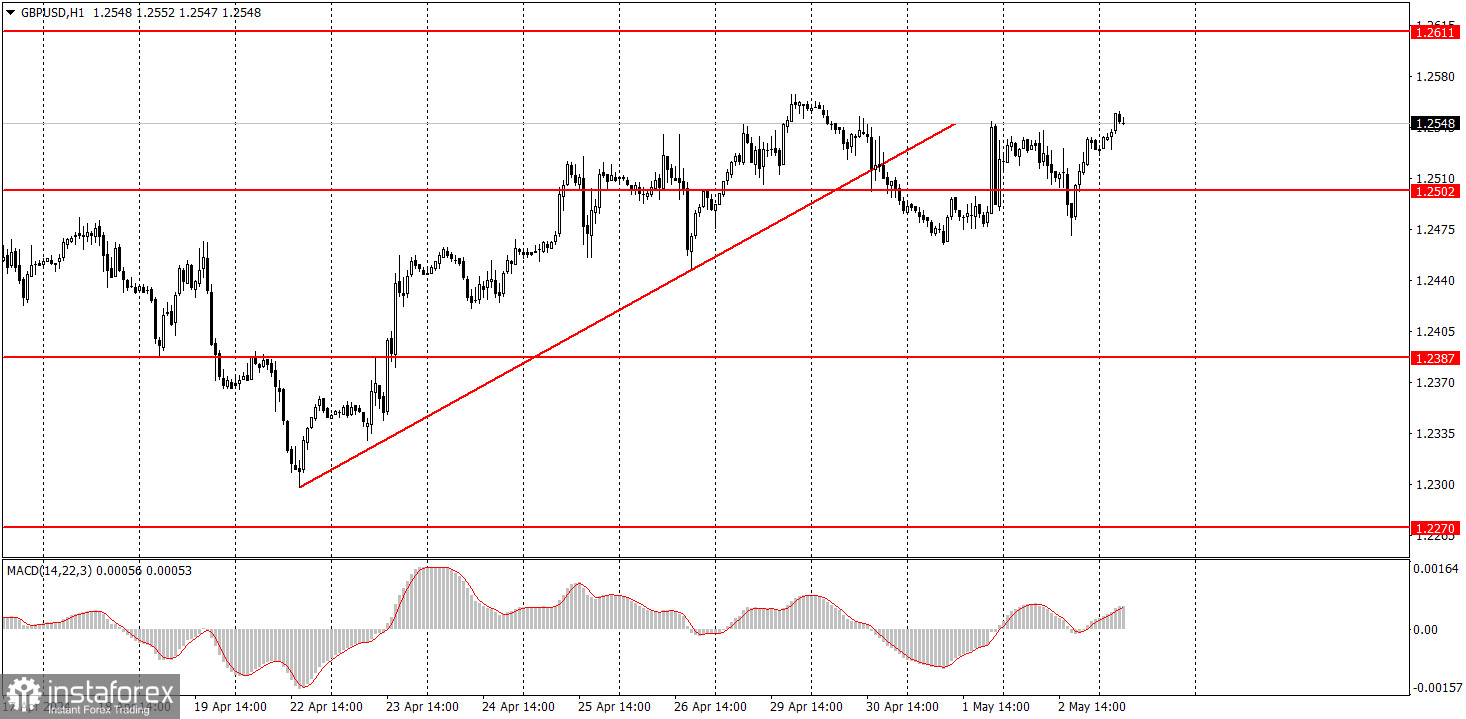
The GBP/USD pair also tried to initiate a downward movement on Thursday after the price consolidated below the ascending trend line, but it ultimately failed. However, the market lacked fundamental and macroeconomic support to resume the upward movement. The price has not surpassed the Monday high, so formally, the trend on the hourly chart has changed to a downward one. However, the pound hasn't begin to decline even when all the factors suggest that it should.
The FOMC meeting was held this week, the results of which could have pleased dollar buyers more than those who are holding onto the pound. Federal Reserve Chair Jerome Powell openly signaled that rate cuts aren't imminent after lack of further progress on inflation. He added that the Fed has no confidence that the target level will be reached, so there will be no talk of monetary policy easing until inflation starts to significantly slow down. In general, this is another "extension" of the period of hawkish policy in the US, which supports the dollar.
GBP/USD on 5M chart
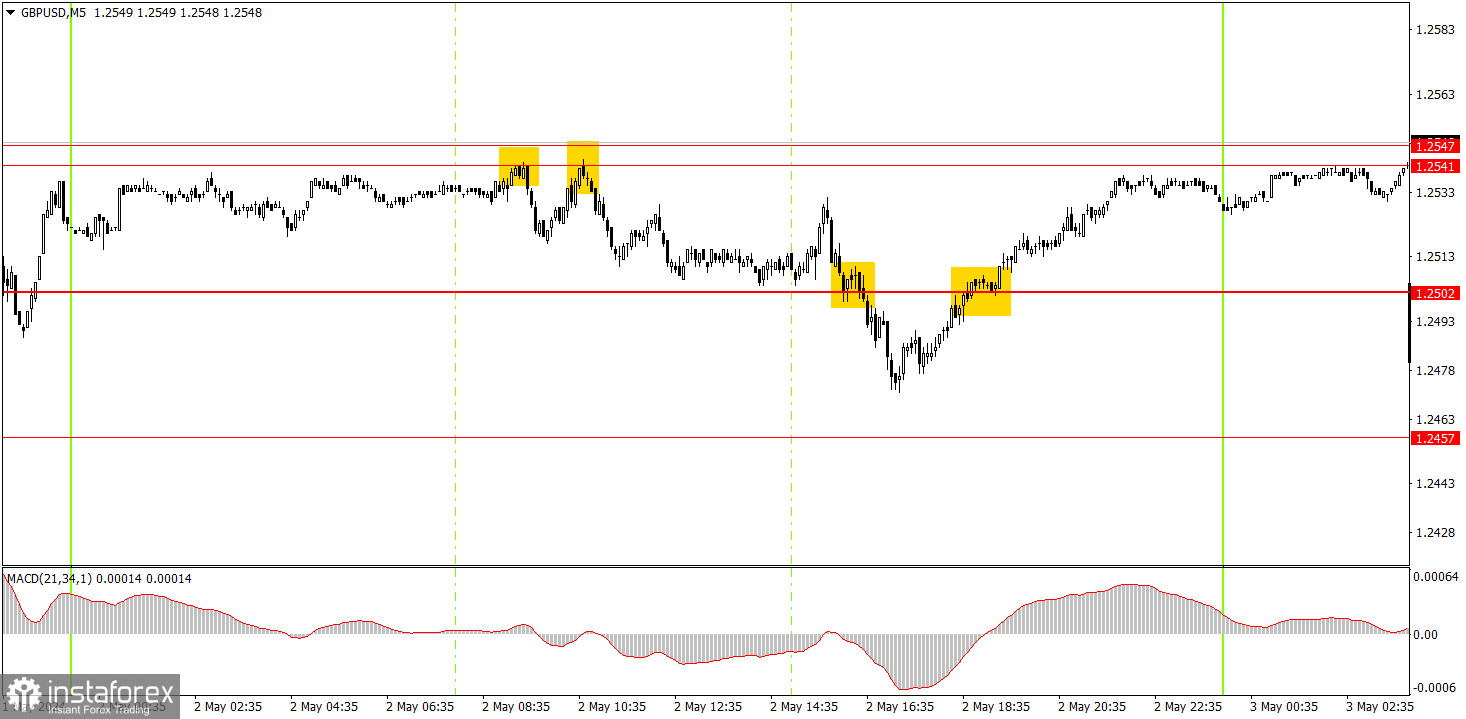
Several trading signals were generated on the 5-minute timeframe. During the European trading session, the pair bounced twice from the area of 1.2541-1.2547, so traders could open short positions. Subsequently, the price continued to fall below the level of 1.2502, but by the end of the day, the quotes returned to the range of 1.2541-1.2547. Thus, traders could earn about 20 pips from a short position. As for the last buy signal near the level of 1.2502, it was formed quite late, so traders could ignore it. Nevertheless, those traders who executed it made profit.
Trading tips on Friday:
On the hourly chart, the GBP/USD pair has excellent prospects for forming a downward trend, but is currently going through a correction. This corrective phase has been quite strong. The fundamental and macroeconomic backdrop continues to support the dollar much more than the British pound. Therefore, we only expect downward movement from the pair.
Today, novice traders can use the area of 1.2541-1.2547 as a reference point. A rebound from this area will make it possible for traders to sell the pair with targets at 1.2502 and 1.2457, which is logical and consistent. Traders may open long positions once the price overcomes this area, which is also a logical move.
The key levels on the 5M chart are 1.2270, 1.2310, 1.2372-1.2387, 1.2457, 1.2502, 1.2541-1.2547, 1.2605-1.2611, 1.2648, 1.2691, 1.2725, 1.2787-1.2791. On Friday, the UK will publish the second estimate of the Services Purchasing Managers' Index (PMI) for April, while the US will release a series of reports on the labor market and wages, as well as the important ISM Non-Manufacturing Purchasing Managers' Index. We may expect some turbulence in the second half of the day.
Basic trading rules:
1) Signal strength is determined by the time taken for its formation (either a bounce or level breach). A shorter formation time indicates a stronger signal.
2) If two or more trades around a certain level are initiated based on false signals, subsequent signals from that level should be disregarded.
3) In a flat market, any currency pair can produce multiple false signals or none at all. In any case, the flat trend is not the best condition for trading.
4) Trading activities are confined between the onset of the European session and mid-way through the U.S. session, after which all open trades should be manually closed.
5) On the 30-minute timeframe, trades based on MACD signals are only advisable amidst substantial volatility and an established trend, confirmed either by a trendline or trend channel.
6) If two levels lie closely together (ranging from 5 to 15 pips apart), they should be considered as a support or resistance zone.
How to read charts:
Support and Resistance price levels can serve as targets when buying or selling. You can place Take Profit levels near them.
Red lines represent channels or trend lines, depicting the current market trend and indicating the preferable trading direction.
The MACD(14,22,3) indicator, encompassing both the histogram and signal line, acts as an auxiliary tool and can also be used as a signal source.
Significant speeches and reports (always noted in the news calendar) can profoundly influence the price dynamics. Hence, trading during their release calls for heightened caution. It may be reasonable to exit the market to prevent abrupt price reversals against the prevailing trend.
Beginners should always remember that not every trade will yield profit. Establishing a clear strategy coupled with sound money management is the cornerstone of sustained trading success.